


Last updated: August 29, 2026 · By: Tim Morris
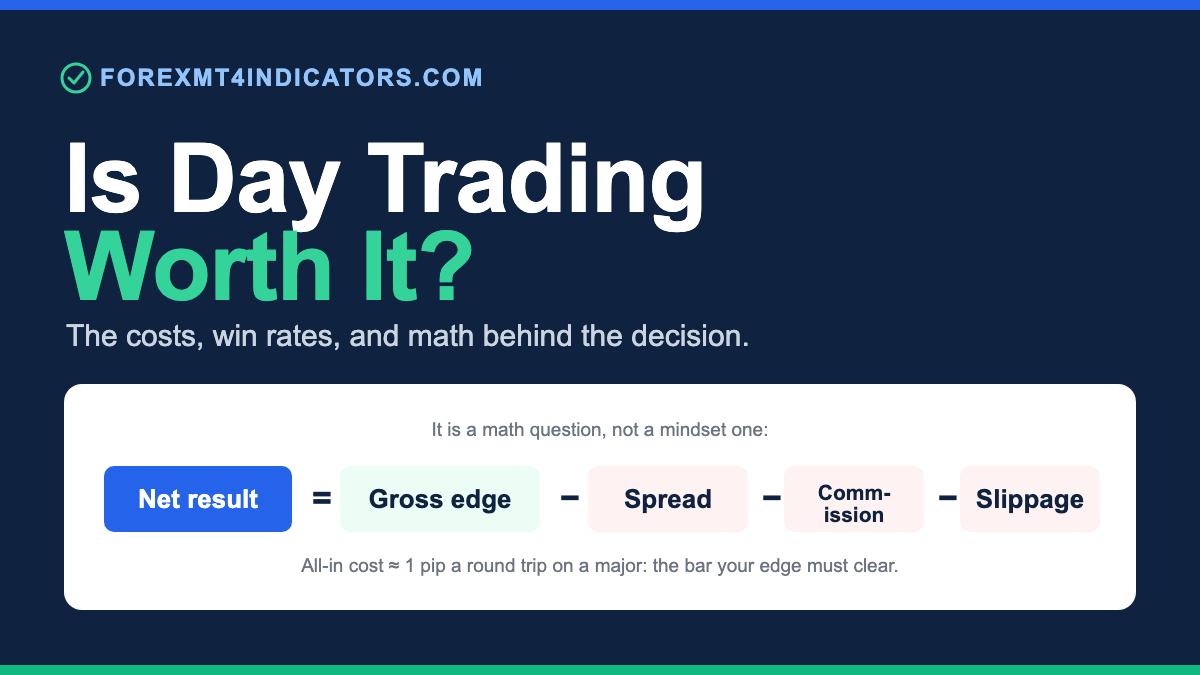
Whether day trading is worth it is a math question, not a mindset one. Your gross edge has to clear spread, commission and slippage, and your win rate has to fit your reward-to-risk. Run those numbers honestly and most part-timers find the answer is no; a disciplined few find yes.
This page treats the question as a profit-and-loss decision rather than a motivational one. You will see the identity that governs every trade, the win rate you need at each reward-to-risk ratio, a worked expectancy example, and the capital and time the job actually demands. Where the numbers land is where the answer lives.
How day trading actually works, as money
Strip away the charts and day trading is one equation repeated. You open a position, price moves some distance, you close before the session ends, and the account is credited that move minus what it cost you to be in the trade. Do that many times and the sum of those net results is your outcome, nothing more.
The identity behind every trade is short. Net result equals your gross edge minus spread, minus commission, minus slippage, minus any overnight financing if you hold past rollover. Day traders close intraday specifically to zero out that last term, which leaves spread, commission and slippage as the costs you always pay.
Gross edge is the part traders obsess over, and cost is the part they forget. A setup can look profitable on a chart and still lose money once the cost stack is subtracted from every entry and exit. The question “is day trading worth it” is, at bottom, “does my gross edge clear my costs often enough, at a reward-to-risk my win rate can support.”
That framing turns a vague ambition into arithmetic you can check. The rest of this page fills in each term: what the costs run, what win rate you need, and what a positive-expectancy system looks like in round numbers. If you want the entry-and-exit mechanics behind the edge itself, our guide to day trading strategies for the forex market covers the setups; this page stays on the money.
The costs behind every trade
Three costs come out of every round trip, and a fourth appears the moment you hold overnight. They are small individually and decisive in aggregate, because a day trader pays them on every one of dozens or hundreds of trades a month.
Spread is the gap between the bid and the ask, the price you cross the instant you enter. On EUR/USD in liquid hours it commonly runs around 0.6 to 1.2 pips on a standard account, tighter on a raw-spread account that charges commission instead. Crosses and exotics run wider, and the spread widens further in thin liquidity and around news.
Commission applies on raw-spread and ECN accounts, typically about $3 to $3.50 per side on a standard 100,000-unit lot, so $6 to $7 round turn. That is roughly 0.6 to 0.7 pip in cost terms, which is why a “zero spread” account is not free: the cost moved into the commission column. All-in, budget on the order of one pip per round trip on a major, which is about $10 per standard lot, $1 per mini, or $0.10 per micro.
Slippage is the difference between the price you expected and the price you got, and it tends to run against you when it matters most. In calm conditions on a liquid major it is a fraction of a pip; around high-impact news it can be several pips or worse. Overnight financing, or swap, is the fourth cost (charged or paid at rollover on positions held past roughly 5 p.m. New York time), and it is the one day traders sidestep by closing out before the session ends.
Wider-spread instruments change the sums. On gold (XAU/USD) the spread often runs 15 to 30 cents an ounce, and with gold near $4,000 in 2026 that is $15 to $30 of cost on a 100-ounce standard lot before slippage. On our house convention one XAU/USD pip is $0.01, so $1 per pip on that lot, which makes a 20-cent spread 20 pips, or $20, two to three times the cost of a comparable EUR/USD round trip.
The win rate you truly need
Win rate on its own tells you nothing about whether you make money. A 90% win rate loses if the 10% of losers are large enough, and a 35% win rate wins if the winners are big enough. What matters is win rate paired with reward-to-risk: how much you make on winners relative to what you lose on losers.
The break-even win rate is a single formula: divide 1 by 1 plus your reward-to-risk ratio. At 1:1 you need to win more than 50% of the time. At 2:1 the break-even drops to 33%, and at 3:1 to 25%. Flip it the other way and a 0.5:1 reward-to-risk needs better than 67% winners merely to tread water.
Costs push every one of those figures up. If your average risk is 20 pips and a round trip costs 1 pip, your effective break-even at 2:1 rises from 33% to about 35%. For a scalper risking 5 pips, that same 1-pip cost is a fifth of the stop, and the 1:1 break-even climbs from 50% to around 60%, a brutal tax that explains why high-frequency scalping is the hardest place to be profitable.
You can map your own numbers against these thresholds rather than guessing. Our break-even win rate calculator turns a reward-to-risk ratio into the win rate you must beat, and the risk-reward and win-rate matrix lays out the whole grid at once so you can see which combinations survive costs and which never do.
Expectancy: the one number that decides it
Expectancy folds win rate, reward-to-risk and costs into a single figure: the average result of one trade, repeated over a large sample. Measured in units of risk (where one unit is what you lose on a losing trade), it is the number that tells you whether a system adds up. Positive expectancy means the process makes money over many trades; negative means it bleeds no matter how hard you work.
Here is the calculation in round numbers. Say you risk one unit to make two, a 2:1 reward-to-risk, win 40% of the time, and pay 0.1 unit in round-trip costs. Expectancy is (0.40 × 2) − (0.60 × 1) − 0.10 = 0.80 − 0.60 − 0.10 = +0.10 units of risk per trade.
Now break the system slightly. Keep everything the same but drop the win rate to 30%, and expectancy becomes (0.30 × 2) − (0.70 × 1) − 0.10 = 0.60 − 0.70 − 0.10 = −0.20 units. The same setup, ten percentage points of win rate apart, is the difference between an edge and a slow bleed, which is why honest measurement of your own win rate matters more than any indicator.
Two cautions keep expectancy honest. First, a positive figure is a long-run average, not a per-trade result: variance means even a +0.10 system has losing streaks and drawdowns, so it is necessary but not sufficient. Second, expectancy computed on a handful of trades is noise, and you need a large, costed sample before you trust it. Our expectancy calculator runs the arithmetic on your own win rate, average win and average loss so the number reflects your record, not a hopeful guess.
How much capital it realistically takes
There is no threshold that switches day trading from unworkable to worthwhile, but capital decides two things that matter: whether you can survive variance, and whether costs stay a small fraction of your trades. Too little of it, and every honest choice works against you.
Start with drawdown. At a 40% win rate, a run of eight to ten consecutive losers sits well inside normal variance: it will happen to a positive-expectancy system, not only a broken one. If you risk 1% per trade, ten losers in a row is a 10% drawdown you can absorb, but risk 5% to make the account feel worthwhile and the same ordinary streak takes 40% or more, deep enough to end most accounts. Position sizing of roughly 0.5% to 1% of the account per trade is what lets an edge play out instead of being wiped by a cold streak.
Small accounts create a trap. Risk a sensible 1% of a $500 account and each trade risks $5, which on a 20-pip stop is a micro-lot position whose returns feel trivial against the screen hours, so the temptation is to over-risk, which variance then punishes. Costs bite harder too, since a fixed one-pip spread is a larger share of a small position’s move.
Sizing method matters as much as size. The Kelly criterion gives the mathematically growth-optimal fraction to risk given your edge, but full Kelly is far too aggressive for real trading (its swings are savage), so most who use it trade a half or a quarter of the figure. Whatever method you choose, the discipline behind it is the subject of our forex risk management guide for beginners, which covers sizing, stops and drawdown limits in one place.
The opportunity cost of day trading
The money math is only half the decision; the other half is what day trading costs you in time, attention and stress. These do not show up in a backtest, and they are where many capable people quietly conclude it is not worth it.
Screen time is the obvious one. Intraday trading ties you to the chart during your chosen session (often the London or New York hours) because the edge lives in moves you have to be present to take. That is hours a day of focused watching, not a passive investment you check on weekly.
The learning curve is longer than the marketing suggests. Reaching consistent, costed profitability tends to take years and thousands of hours of trading, journaling and review, and a large share of people never get there. A 2020 study of Brazilian equity-futures day traders by Chague, De-Losso and Giovannetti found that of those who persisted for more than 300 days, 97% lost money, a sobering base rate for the time you would be investing.
Then there is the psychological cost. Day trading applies constant small doses of fear, greed and regret, and managing your own reactions under live money is a skill that takes as long to build as the strategy itself. If any of this reads as a poor trade for your time, that answer is as valid as any spreadsheet, and points you toward whether day trading is closer to investing or to gambling for your temperament.
Who day trading is and isn’t worth it for
Reduced to a sentence, day trading is worth it for a minority who treat it as a costed business and a poor trade for the majority who treat it as a shortcut. The dividing line is process, capital and temperament, not ambition.
It is unlikely to be worth it if you are undercapitalised, need income from it soon, have not tested an edge that survives costs, or cannot sit through a ten-trade losing streak without abandoning the plan. Trading a live, small account to learn on is one of the most expensive classrooms there is, and the pressure of needed income tends to force exactly the over-risking that variance punishes.
It can be worth it if you have tested a positive-expectancy process on a real sample, hold enough capital to size at 0.5% to 1% and survive drawdown, keep costs low relative to your average move, and can absorb the screen hours without wrecking the rest of your life. That is a demanding list, and meeting it is what separates the small group who make the math work.
Education shortens the odds without changing them. If you are building the process rather than chasing signals, a grounding in the classics helps. Our roundup of the best day trading books points to the risk-and-psychology titles that tend to outlast any single strategy.
Common mistakes that wreck the day-trading math
Counting gross pips and ignoring the cost stack. A setup that looks green on the chart can be red once spread, commission and slippage come out of every entry and exit. Fix: subtract realistic round-trip costs from every trade in your testing before you call an edge real.
Pairing a high win rate with a poor reward-to-risk. An 80% win rate still loses money at 0.2:1, because the occasional loser erases many small winners. Fix: check win rate and reward-to-risk together against the break-even formula, not in isolation.
Scalping stops so tight that costs swamp the edge. When a 1-pip cost is a fifth of a 5-pip stop, you need a punishing win rate to overcome it. Fix: measure cost as a fraction of your average risk, and widen the stop or trade less often if that fraction is large.
Over-risking to make a small account feel worthwhile. Risking 5% a trade turns an ordinary losing streak into a blown account. Fix: size at 0.5% to 1% per trade so variance cannot end the account before your edge shows up.
Mistaking a good month for an edge. Variance hands lucky runs to losing systems and cold runs to winning ones over small samples. Fix: judge the process on expectancy across a large, costed sample rather than on recent results.
Quitting steady income before the numbers prove out. Needed income forces the over-risking and revenge trading that variance punishes hardest. Fix: trade small alongside your job until a documented sample shows positive expectancy after costs.
The verdict: is day trading worth it
The honest answer is conditional, because the question is arithmetic wearing a lifestyle costume. Day trading is worth it when your tested gross edge clears spread, commission and slippage, your win rate fits your reward-to-risk with room to spare, and you are capitalised to survive the variance that a real edge still produces. When those conditions hold, the screen hours buy something; when they do not, they buy a slow bleed.
For most part-timers the numbers do not clear the bar, and the base rates (97% of persistent traders losing in the study above) reflect that. For a disciplined, capitalised, process-driven minority they do. Run your own figures honestly before you decide, and let the expectancy after costs, not the appeal of the idea, cast the deciding vote.
Frequently asked questions
Is day trading profitable?
It is for a minority and unprofitable for most. A 2020 study of Brazilian day traders found 97% of those who persisted beyond 300 days lost money, and other market studies reach similar conclusions. Profitability is possible with a tested edge that clears costs, but the base rate for people without one is poor.
What win rate do you need to break even?
It depends entirely on your reward-to-risk ratio: break-even win rate equals 1 divided by 1 plus that ratio. At 1:1 you need better than 50%, at 2:1 about 33%, and at 3:1 about 25%. Costs raise each of those figures, and the smaller your stop relative to the spread, the more they rise.
How much do spreads and commissions cost a day trader?
On a major like EUR/USD, budget on the order of one pip per round trip all-in, which is roughly $10 per standard lot, $1 per mini, or $0.10 per micro. Raw-spread accounts move part of that into a commission of about $6 to $7 round turn per standard lot. Because a day trader pays this on every trade, frequency multiplies the drag: a hundred trades a month is a hundred round trips of cost.
How much money do you need to day trade?
There is no magic figure, but you need enough to size at 0.5% to 1% per trade and still survive a normal drawdown, and enough that fixed costs stay a small fraction of each move. Small accounts push people to over-risk, which variance then punishes. A funded prop account is one route to larger size without personal capital, though it comes with its own rules and fees.
How does day trading work?
You open positions to capture intraday price moves and close them before the session ends, avoiding the overnight swap that longer-term traders pay. Your result on each trade is the distance price moved in your favour minus spread, commission and slippage. Repeat across many trades and the net of those costed results (not any single win) is your outcome.
How long does it take to become consistently profitable?
For most who get there at all, it takes years and thousands of hours of trading, journaling and review, not weeks. A large share of people never reach consistent profitability after costs, which is part of the honest picture. Treat it as a long apprenticeship rather than a quick income switch.
Is day trading worth it for beginners?
Rarely in the early going, because beginners combine an untested edge, small capital and raw psychology, the three things variance exploits. Starting on a demo account and then a small live account keeps the tuition affordable while you build a costed record. If you need the money soon, the pressure works against you, and another approach may fit better.
Is day trading worth it compared with swing trading?
Swing trading takes fewer trades, so cumulative costs and screen hours are lower, but it carries overnight swap and gap risk that day traders avoid. Day trading gives more control and no overnight exposure, at the price of higher cost drag and hours tied to the screen. Neither is superior in the abstract: the better fit depends on your edge, your costs and the time you can give it.
Ready to put this into practice?
Open an account with a regulated broker and apply what you have learned. These are the three brokers we recommend:
Trading forex and CFDs carries a significant risk of loss and is not suitable for everyone. Broker links are affiliate links — we may earn a commission at no cost to you.