


Last updated: August 29, 2026 · By: Tim Morris
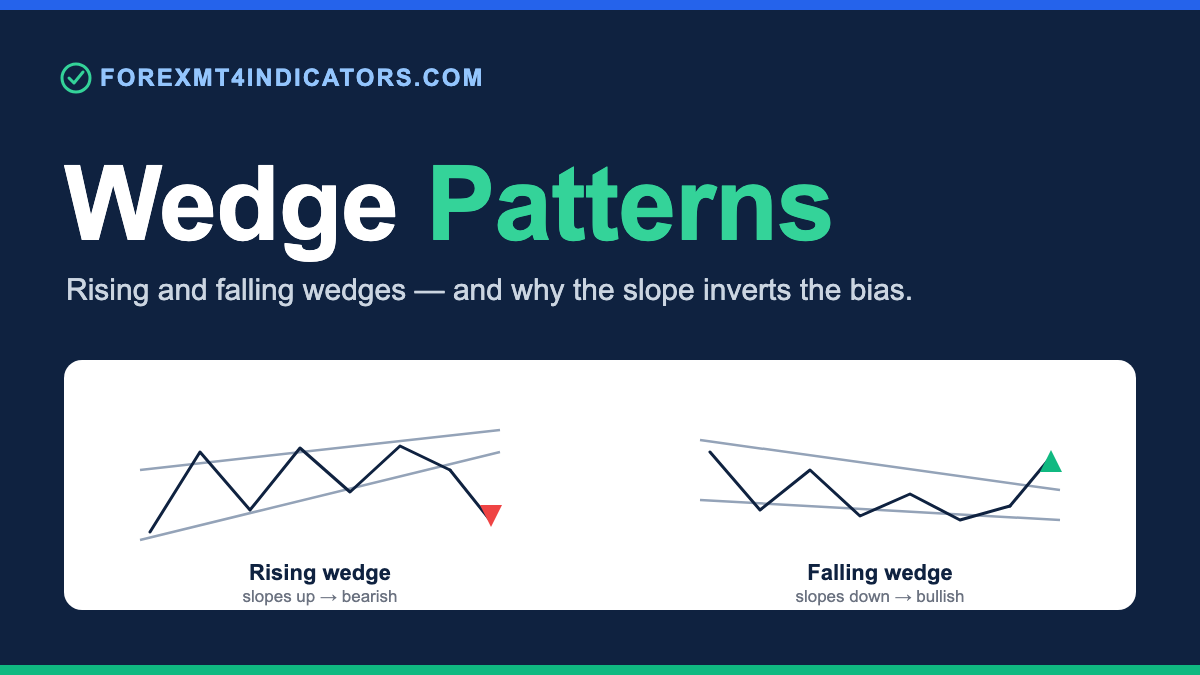
A wedge pattern is a chart formation of two converging trendlines that both slope the same way, tracking a trend that is losing momentum. A rising wedge slopes up and leans bearish; a falling wedge slopes down and leans bullish. The break beyond the trendline, confirmed by a candle close, is the signal.
What is a wedge pattern
A wedge is a shape price draws when a move narrows toward a point. Two trendlines close in on each other, and both tilt in the same direction: either both up or both down. That shared tilt is what separates a wedge from a triangle, where at least one line runs flat or the two lines pull apart symmetrically.
The narrowing tells a story about momentum. Each new swing covers less ground than the last, so the range between the lines shrinks. When one side of the market finally gives up, price snaps out of the wedge and often runs a distance tied to the pattern’s own height.
The counterintuitive part is the direction of that break. A wedge that slopes up tends to break down, and a wedge that slopes down tends to break up. Traders who read the slope as the destination get this backward, which is where much of the confusion around wedges comes from.
Wedges belong to the wider family of price shapes covered in our chart patterns cheat sheet. This page is the deep read on the wedge alone: its anatomy, its bias, and the break that turns the shape into a probability worth acting on.
The anatomy of a wedge
Every wedge has the same three parts, and reading them in order keeps you honest about whether the shape is real.
The first part is the pair of converging trendlines. You need at least two touches on each line (two swing highs on the upper line, two swing lows on the lower line) before the wedge counts. One line is steeper than the other, which is what pulls them toward a meeting point called the apex.
The second part is the slope relative to the prior trend. A wedge is defined by where both lines point, not by the size of the candles inside it. Both lines up gives a rising wedge; both lines down gives a falling wedge; the two lines always angle toward each other rather than running parallel.
The third part is volume, or its forex proxy. Traded volume on spot forex is broker-specific, so most traders read tick volume or candle range instead. Inside a healthy wedge the range contracts toward the apex (candles get smaller as buyers and sellers run out of conviction) and the breakout candle expands again as one side takes control.
That contraction into the apex is the tell. A wedge whose candles stay wide all the way to the point is a channel in disguise, and it lacks the coiled-spring quality that makes the break worth trading.
Rising wedge versus falling wedge: why the slope inverts the bias
This is the part readers get wrong, so it earns its own section. The bias of a wedge runs opposite to its slope, and the reason sits in the geometry of the two lines.
In a rising wedge, both trendlines point up, but the lower line rises faster than the upper line. That means each higher low is gaining ground quicker than each higher high: buyers are working harder for smaller and smaller rewards at the top. When they can no longer lift price to the upper line, the floor gives way and price breaks down. So a rising wedge leans bearish.
In a falling wedge, both trendlines point down, but the upper line falls faster than the lower line. Sellers are pushing price down, yet each new low undercuts the last by less and less: selling pressure is fading. When sellers exhaust themselves against the lower line, price breaks up through the ceiling. So a falling wedge leans bullish.
Read it as a spring, not an arrow. The slope shows the direction of the tiring side; the break comes from the side that had more left in the tank. A rising wedge exhausts the buyers and rewards the sellers; a falling wedge exhausts the sellers and rewards the buyers.
None of this makes the break a certainty. The lean is a probability that tilts one way, and it stays a shape on the screen until a candle closes beyond the trendline to confirm it.
Reversal or continuation: where the wedge forms decides
A wedge can act as a reversal or a continuation, and the location on the larger trend is what settles which. Same shape, two possible roles: this is why wedges reward patience over prediction.
A rising wedge after a long uptrend tends to be a reversal: the trend is tiring, and the break down starts a new move lower. A rising wedge inside a downtrend, formed during a pullback, tends to be a continuation: the counter-trend bounce runs out of steam, and the break down resumes the original fall. Either way the rising wedge breaks down: location changes the story, not the direction.
The falling wedge mirrors this. A falling wedge after a long downtrend tends to be a reversal to the upside; a falling wedge inside an uptrend, formed during a pullback, tends to be a bullish continuation. In both cases the falling wedge breaks up.
The practical takeaway is to mark the higher-timeframe trend before you label a wedge. A wedge that breaks in the direction of the dominant trend carries better odds than one fighting it, which is one reason continuation wedges tend to resolve more cleanly than reversal wedges.
How to identify a wedge on a chart
Spotting a wedge is a matter of ruling out the lookalikes. Two shapes fool traders most: the channel and the triangle.
Start by drawing the two trendlines across the swing points. If both lines slope the same way and lean toward each other, you have a wedge. If the lines run parallel, it is a channel, not a wedge, and the converging-momentum logic does not apply. If one line is flat and the other slopes, it is an ascending or descending triangle, which carries its own bias rules.
Next, check the touches. A trustworthy wedge shows at least two clean touches on each line, ideally three, so the boundaries are real levels and not lines your eye forced onto the chart. A wedge you can only see after drawing five trendlines is not a wedge.
Then read the contraction. Watch the candle range shrink as price travels toward the apex: that fading range is the momentum draining out of the trend. Wedges on the H4 and daily charts stand out more clearly than wedges on the M5, where noise manufactures shapes that dissolve within hours.
If drawing converging lines by hand slows you down, a scanner can flag candidates for you to judge. Our wedge pattern MT4 indicator plots the two converging trendlines automatically, and the companion wedge pattern forex indicator marks the break so you can focus on the confirmation rather than the geometry. Treat either as a spotter, not a trigger: the trade logic still runs on the break, the stop, and the measured target.
How to trade a wedge
Trading a wedge comes down to three decisions: what confirms the break, where the risk sits, and where the move should end. The logic below is conceptual, not a pip-level recipe: the exact levels depend on your pair, timeframe, and risk plan.
The trigger is a candle close beyond the trendline on your trading timeframe. For a rising wedge, that means a close below the lower line; for a falling wedge, a close above the upper line. A wick that pierces the line and closes back inside is not a break. It is a probe, and acting on it before the close is the most common way traders get trapped.
The risk sits on the other side of the wedge. A short on a rising-wedge break down places its stop above the last swing high inside the wedge, not one tick above the trendline where a normal retest would sweep it. A long on a falling-wedge break up places its stop below the last swing low inside the wedge. The stop marks the price that proves the pattern wrong, so it belongs beyond the structure, not hugging it.
The direction is set by the wedge type, confirmed by the break, never assumed from the slope. Many traders wait for one extra piece of agreement before committing, such as a confirming candle signal at the break. The candle-level side of that read is covered in our forex candlestick patterns guide, and a bearish engulfing at a rising-wedge break tells you the same story the wedge does, on a smaller scale.
If you want the level-plus-candle method laid out setup by setup, The Candlestick Playbook walks through the pattern-at-a-level approach candle by candle in one focused ebook for $27.
A note on timing: the break tends to arrive before price reaches the apex, often around two-thirds of the way in. Waiting for the lines to actually touch usually means waiting through the break and missing the move.
How to set a price target: the measured move
The wedge carries its own target built into its shape, which is one reason the pattern is worth learning to read.
Measure the height of the wedge at its widest part: the vertical distance between the two trendlines at the back of the pattern, where they are furthest apart. Project that distance from the breakout point in the direction of the break. That projection is the measured-move target, and it gives you an exit grounded in the pattern rather than a round number you hope price reaches.
A second, more conservative target is the origin of the wedge: the price level where the pattern began. Reversal wedges often retrace to that starting level and stall there, so it works as a first take-profit before the fuller measured move. Scaling out part of the position at the origin and holding the rest for the projection is a common way to manage the trade.
Set the target before you enter, then size the position so the distance to the stop represents a fixed slice of your account. A clean wedge break that offers less than a 1:1.5 reward-to-risk after spread is usually not worth taking, regardless of how good the shape looks.
When a wedge fails
Wedges fail often enough that treating any single break as a sure thing will drain an account. Knowing the failure modes is what keeps the losses small.
The most frequent failure is the false break. Price closes beyond the trendline, pulls you in, then reverses back inside the wedge and heads the other way. False breaks cluster in thin liquidity (the late Asian session) and around high-impact news, when a data release repriced the market regardless of the shape.
The second failure is the premature entry. A trader shorts a rising wedge while price is still inside it, betting the break before any close confirms it. The wedge can push higher for several more candles, stopping out the early short before the real break arrives.
The third failure is the wrong-context wedge. A reversal wedge fighting a strong higher-timeframe trend gets run over by that trend more often than it reverses it. A falling wedge in a savage downtrend can keep failing to break up until the larger trend itself turns.
The fix for all three is the same discipline: wait for the close, place the stop beyond the structure, and size so a false break costs a planned amount rather than a painful one. A pattern that shows probability, not certainty, has to be traded like one.
Common mistakes traders make with wedges
Reading the slope as the direction. A rising wedge looks bullish and breaks bearish. Fix: memorise that the break runs opposite the slope, and label the wedge by type before you guess the direction.
Entering before the close. A wick beyond the trendline is a probe, not a break. Fix: require a full candle close beyond the line on your trading timeframe before you act.
Forcing the shape. Draw enough trendlines and any chart hides a wedge. Fix: demand at least two clean touches per line, and skip the pattern if the lines do not converge.
Confusing a wedge with a channel. Parallel lines are a channel and follow different rules. Fix: check that both lines lean toward each other before you apply wedge logic.
Stops too tight against the retest. A stop one tick beyond the trendline gets swept on a normal pullback to the broken line. Fix: place the stop beyond the last swing inside the wedge, then size the position to hold risk fixed.
Ignoring the trend context. A reversal wedge against a strong daily trend is a weak trade. Fix: mark the higher-timeframe trend first, and favour wedges that break with it.
Wedges on gold (XAU/USD)
Wedges form on gold as clearly as on any forex pair, but XAU/USD demands two adjustments because its noise is wider. In 2026 gold trades around the $4,000-per-ounce area with an average daily range near $60 to $110 an ounce, so its swings and wicks are large in absolute terms.
The first adjustment is the stop. A stop that sits a few cents beyond a wedge trendline gets swept on a routine retest, so widen it to sit beyond gold’s recent swing measured in dollars per ounce, then cut the lot size to keep the cash risk the same. Framing the trade by price distance in dollars per ounce first (before converting to any pip figure) keeps the risk honest.
The second adjustment is timing. Gold can spike straight through a clean wedge and reverse around CPI, NFP, and FOMC releases, so wait for those events to pass before trusting a break near them. On our house convention one XAU/USD pip equals $0.01, which is $1 per pip on a 100-ounce standard lot, but reason in price distance, then translate to pips last, so a label from one convention never gets pinned to a value from another.
Frequently asked questions
Is a rising wedge bullish or bearish?
A rising wedge is bearish. Both trendlines slope up, but the lower line rises faster than the upper, so buyers are gaining less ground with each push. When they run out, price breaks down through the lower line. The upward slope makes it look bullish, which is the trap: the confirmed break is to the downside.
Is a falling wedge bullish or bearish?
A falling wedge is bullish. Both lines slope down, but the upper line falls faster than the lower, so selling pressure is fading. When sellers exhaust themselves, price breaks up through the upper line. As always, the lean is a probability, and it only becomes a signal once a candle closes beyond the trendline.
What is the difference between a wedge and a triangle?
In a wedge both trendlines slope the same way and lean toward each other. In a triangle at least one line is flat (an ascending triangle has a flat top, a descending triangle a flat bottom) or the two lines converge symmetrically around a horizontal axis. The shared slope is what makes a wedge a wedge.
How do I confirm a wedge breakout?
Wait for a candle to close beyond the trendline on your trading timeframe: below the lower line for a rising wedge, above the upper line for a falling wedge. A wick that pierces the line and closes back inside is a false break, not a confirmation. Many traders add a confirming candle signal or a retest of the broken line for extra agreement.
Where do I set the target on a wedge?
Measure the wedge’s height at its widest point, then project that distance from the breakout in the direction of the break. That is the measured move. A more conservative first target is the price level where the wedge began, since reversal wedges often retrace to their origin before continuing.
Is a wedge a reversal or a continuation pattern?
It can be either, and the location decides. A wedge that forms at the end of a long trend tends to reverse it; a wedge that forms during a pullback inside a trend tends to continue it. The break direction stays fixed by the wedge type (rising wedges break down, falling wedges break up) regardless of the role.
Do wedge patterns work on lower timeframes like M5?
They form on every timeframe but are less reliable on the M5 and M15, where spread cost and random noise turn many breaks into fakeouts. The H4 and daily produce cleaner wedges with fewer false breaks. If you trade wedges intraday, favour the H1, require a clean close, and avoid thin sessions.
Can an indicator detect wedges automatically?
Yes, a scanner can plot the converging trendlines and flag the break for you, which speeds up spotting the shape. It does not replace the trade logic, though: the break confirmation, the stop beyond the structure, and the measured target still need your judgement. Treat any automated wedge tool as a spotter, not a signal to enter blind.
Glossary of related terms
- Wedge: a pattern of two converging trendlines that both slope the same way, tracking a tiring trend toward a break.
- Apex: the point where the two trendlines would meet; the break usually comes before price reaches it.
- Rising wedge: an up-sloping wedge that leans bearish and tends to break below its lower line.
- Falling wedge: a down-sloping wedge that leans bullish and tends to break above its upper line.
- Measured move: projecting the wedge’s widest height from the breakout point to set a target.
- False break: a close beyond a trendline that reverses back inside, trapping traders who entered early.
- Apex contraction: the shrinking candle range toward the point of the wedge that signals fading momentum.
- Confirmation: the candle close beyond the trendline that turns a wedge shape into a tradeable signal. For the candle-level side, see our forex candlestick patterns guide.
Related reading
- Chart patterns cheat sheet: where the wedge sits among every major forex pattern.
- Wedge pattern MT4 indicator: plots the converging trendlines automatically.
- Wedge pattern forex indicator: marks the break for confirmation.
- Forex candlestick patterns: the candle-level companion for timing the break.
- Free candlestick cheat sheet: a save-and-print reference for the candle side.
Forex and CFD trading carries a high level of risk and may not be suitable for all traders. The patterns and rules described here are educational, and patterns show probability, not certainty. Past performance does not guarantee future results. Test any approach on a demo account before risking real capital.
Ready to put this into practice?
Open an account with a regulated broker and apply what you have learned. These are the three brokers we recommend:
Trading forex and CFDs carries a significant risk of loss and is not suitable for everyone. Broker links are affiliate links — we may earn a commission at no cost to you.