

Last updated: August 28, 2026 · By: Tim Morris


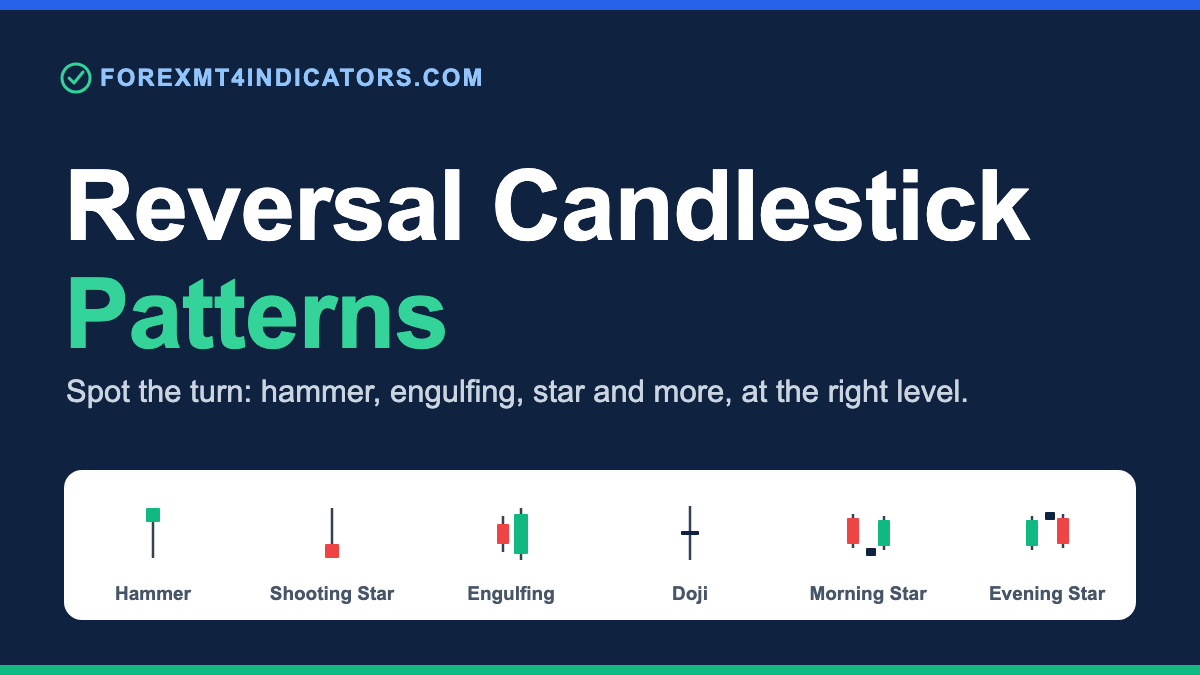
Reversal candlestick patterns are single or multi-candle formations that signal a possible shift in trend direction. Bullish reversals like the hammer and bullish engulfing form at downtrend lows; bearish reversals like the shooting star and evening star form at uptrend highs. Every reversal pattern needs next-candle confirmation before it becomes a trade.
That last sentence is where most traders lose money, so we built this list around it. For the wider context, read our complete forex candlestick patterns guide, then keep this page open as your reference.
What are reversal candlestick patterns
A reversal candlestick pattern is a formation of one to three candles that suggests the current trend is running out of participants and price may turn. The pattern is a footprint of a fight between buyers and sellers, printed as body-to-wick geometry.
The key word is suggests. A hammer at a downtrend low tells you sellers pushed price down, then buyers slammed it back before the close: a change in who is winning, not proof the trend has ended. The same hammer mid-range means nothing; location is half the signal.
Why confirmation is the whole game
A candlestick pattern that the next candle has not confirmed is a shape, not a signal. Price prints thousands of hammers and shooting stars every week across the majors, and most lead nowhere.
Confirmation means waiting for the candle after the pattern to close in its direction: above the pattern’s high for a bullish reversal, below its low for a bearish one. We call an unconfirmed pattern “a pattern in mid-air,” and skipping those is the single habit that separates traders who profit from candlesticks from those who donate to the market. For the mechanics of reading each candle, see our guide on how to use candlestick patterns in forex trading.
The reversal candlestick patterns cheat table
Here is the full list in one scannable block. Bias is the direction the pattern points; where it must form is the location filter that turns a shape into a signal; confirmation is the candle you wait for before entering.
| Pattern | Bias | Where it must form | Confirmation (next candle) |
|---|---|---|---|
| Bullish engulfing | Bullish | Green body fully engulfs the prior red body at a downtrend low | Closes above the engulfing high |
| Bearish engulfing | Bearish | Red body fully engulfs the prior green body at an uptrend high | Closes below the engulfing low |
| Hammer | Bullish | Small body, lower wick 2×+ the body, at a downtrend low | Closes above the hammer’s high |
| Inverted hammer | Bullish | Small body, long upper wick, at a downtrend low | Closes above the inverted hammer’s high |
| Shooting star | Bearish | Small body, upper wick 2×+ the body, at an uptrend high | Closes below the star’s low |
| Hanging man | Bearish | Small body, long lower wick, at an uptrend high | Closes below the hanging man’s low |
| Dragonfly doji | Bullish | Open ≈ close near the high, long lower wick, at a low | Closes above the doji’s high |
| Gravestone doji | Bearish | Open ≈ close near the low, long upper wick, at a high | Closes below the doji’s low |
| Morning star | Bullish | Big red, small-body middle, big green into the first body, at a low | Third candle closes past the first body’s midpoint |
| Evening star | Bearish | Big green, small-body middle, big red into the first body, at a high | Third candle closes past the first body’s midpoint |
| Tweezer bottom | Bullish | Two candles sharing the same low at a downtrend low | Closes above the tweezer high |
| Tweezer top | Bearish | Two candles sharing the same high at an uptrend high | Closes below the tweezer low |
| Piercing line | Bullish | Red, then green opens below the prior close, closes above the red body’s midpoint | Holds above the piercing close |
| Dark cloud cover | Bearish | Green, then red opens above the prior close, closes below the green body’s midpoint | Holds below the close |
| Three white soldiers | Bullish | Three long green candles, each closing higher, after a downtrend | Fourth candle holds above the third close |
| Three black crows | Bearish | Three long red candles, each closing lower, after an uptrend | Fourth candle holds below the third close |
Save the free forex candlestick cheat sheet if you want a printable image for your desk. The table above is the working version; the cheat sheet is the wall version.
Bullish reversal patterns and where they form
Bullish reversals appear at the bottom of a move, after price has been falling. They share one story: sellers tried to push lower and failed, and buyers closed the candle strong.
Hammer and dragonfly doji (single candle)
The hammer is a small body at the top of the candle with a long lower wick at least twice the body length, printed at a downtrend low: sellers drove price down, buyers reclaimed it before the close. Confirmation is the next candle closing above the hammer’s high. The full setup is in our hammer pattern forex candlestick strategy. The dragonfly doji is the stricter cousin, with open and close together near the high and no real body; it signals the same rejection and also needs a level under it to matter.
Bullish engulfing and piercing line (two candle)
A bullish engulfing is a green candle whose body fully engulfs the prior red body at a downtrend low; the engulf must cover the body, not the wicks, and the more it swallows the stronger the signal. Confirmation is the following candle closing above the engulfing high. A piercing line is the weaker two-candle version (a red candle, then a green one that opens below the prior close and closes above the 50% midpoint of the red body), so treat it as a hint that still needs the next candle to hold above the piercing close.
Morning star, tweezer bottom, and three white soldiers (multi candle)
A morning star is a three-candle bottom (a large red candle, a small-bodied middle candle that stalls, then a large green candle closing deep into the first body), and the three-candle agreement makes it one of the more reliable reversals. A tweezer bottom is two candles sharing almost the same low at a downtrend low, and three white soldiers are three long green candles after a downtrend, each closing higher with small upper wicks. Both still want a fresh candle to confirm before you commit size.
Bearish reversal patterns and where they form
Bearish reversals appear at the top of a move, after price has been rising. They are mirror images of the bullish set: buyers tried to push higher and failed, and sellers closed the candle strong.
Shooting star, hanging man, and gravestone doji (single candle)
The shooting star is a small body at the bottom of the candle with a long upper wick at least twice the body length, printed at an uptrend high: buyers pushed up, sellers rejected it, and the candle closed near its low. Confirmation is the next candle closing below the star’s low, and the full playbook lives in our trend-following shooting star forex strategy. The hanging man shares the hammer’s shape but forms at an uptrend high, flipping to bearish, while the gravestone doji is the shooting star’s doji form. Only the preceding trend separates these from their bullish twins.
Bearish engulfing and dark cloud cover (two candle)
A bearish engulfing is a red candle whose body fully engulfs the prior green body at an uptrend high; the deeper it swallows the prior candle, the stronger the read, and confirmation is the next candle closing below the engulfing low. Entry rules sit in our engulfing pattern forex strategy. Dark cloud cover is the bearish mirror of the piercing line: a green candle, then a red one that opens above the prior close and closes below the 50% midpoint of the green body. It is a warning at the top until the following candle holds below the close.
Evening star, tweezer top, and three black crows (multi candle)
An evening star is the three-candle top: a large green candle, a small-bodied middle candle that stalls, then a large red candle closing deep into the first body, marking where the uptrend ran out of buyers. A tweezer top is two candles sharing almost the same high at an uptrend high, and three black crows are three long red candles after an uptrend, each closing lower with small lower wicks. Both are stronger than a single candle because more sessions agree on the direction.
How to trade a reversal pattern: entry, stop, target
Wait for the confirmation candle from the cheat table to close, then enter at the open of the candle after confirmation, or on a limit at the pattern’s midpoint for a better price. Never enter on the pattern candle before its own close. It is not finished forming and can flip on you.
The pattern must sit at a level you marked before it printed: a prior swing high or low, a round number, or a supply or demand zone. A pattern at a fresh level is a trade; a pattern in open space is noise. The $27 Candlestick Playbook walks through 20-plus of these level-plus-pattern setups candle by candle if you want the annotated version.
Place the stop beyond the pattern’s extreme wick plus a buffer, not at the body: below a hammer’s low, above a shooting star’s high. On EUR/USD H1 that buffer is usually 5-10 pips, sized off ATR(14). Target the nearest opposing structure, aim for a 1:2 risk-to-reward, and move the stop to breakeven once price clears the first level.
Timeframe notes: where reversal patterns work and where they fail
Reversal candlesticks are most reliable on H1, H4, and D1. On these timeframes each candle represents enough orders that the rejection story is real, and the spread is a small fraction of the range.
On M5 and M1 the same patterns fire constantly and fail constantly: a 3-pip hammer on M1 is noise, and the spread eats a large slice of the move before you enter. The D1 chart gives the highest-quality reversals but the fewest. A daily bullish engulfing at a weekly support level is one of the cleaner setups in forex, and you might see two or three a month per pair.
When reversal candlestick patterns fail
Reversal patterns fail most often for reasons that have nothing to do with the candle itself. They fail against a strong higher-timeframe trend: a bearish engulfing on H1 inside a raging D1 uptrend is usually a pullback, not a top, and the daily trend runs it over.
They fail during news: a hammer two minutes before NFP or CPI means nothing, because the release reprices the market regardless of the candle. They also fail in dead liquidity, where the late Asian session produces long, meaningless wicks that fake hammer and shooting-star shapes with no follow-through.
Hammer vs hanging man vs shooting star vs inverted hammer
These four candles cause more confusion than the rest of the list combined, because two pairs are identical in shape and only location tells them apart. A hammer and a hanging man look the same; a shooting star and an inverted hammer look the same.
| Pattern | Shape | Where it forms | Bias |
|---|---|---|---|
| Hammer | Small body, long lower wick | Bottom of a downtrend | Bullish |
| Hanging man | Small body, long lower wick | Top of an uptrend | Bearish |
| Shooting star | Small body, long upper wick | Top of an uptrend | Bearish |
| Inverted hammer | Small body, long upper wick | Bottom of a downtrend | Bullish |
The lesson applies to the whole list: the shape is half the signal, and the trend it sits in is the other half. Read only the shape and you will short bottoms and buy tops; read the location first and the shape confirms what structure already told you.
Reversal patterns on XAU/USD (gold)
Reversal candlesticks work on gold, but XAU/USD punishes the shape-only reader harder than any forex pair. Gold’s average daily range runs $60 to $110 or more per ounce and its wicks are long, so it prints false hammers and shooting stars constantly.
Two adjustments matter. Demand a bigger, cleaner pattern (a gold hammer worth trading has a lower wick of several dollars per ounce, not a few cents) and size stops for gold’s wicks: a reversal stop that is 8 pips on EUR/USD H1 often needs $4 to $8 per ounce on XAU/USD H1, which means a smaller lot for the same cash risk.
Session and news sensitivity are sharper on gold. Reversal patterns during the London and New York sessions carry weight; the same shapes in the quiet Asian session frequently fill and reverse again by the London open. Ignore any reversal candle within 30 minutes of a US CPI, NFP, or FOMC release.
Common mistakes traders make with reversal patterns
Trading the pattern in mid-air. A hammer or engulfing at no level has no reason to hold. Fix: only take a reversal that sits at a swing high or low, round number, or support/resistance zone drawn before the candle formed.
Skipping confirmation. Entering before the next candle confirms doubles your losing trades. Fix: wait for the candle after the pattern to close beyond its high (bullish) or low (bearish), then enter.
Confusing a hammer with a hanging man. The two share a shape but mean opposite things by trend. Fix: check the preceding trend first. A long lower wick at a low is bullish, the same candle at a high is bearish.
Marking every long-wick candle as a hammer or star. Not every wick is a rejection. Fix: require the wick to be at least 2× the body, with the body in the top third (hammer) or bottom third (shooting star).
Fighting the higher timeframe. A reversal on H1 against a strong D1 trend usually gets run over. Fix: only take reversals that agree with H4/D1 structure, or that form at a major higher-timeframe level.
Stops too tight, inside the wick. A stop at the body gets you wicked out before the move. Fix: put the stop beyond the pattern’s extreme wick plus an ATR-based buffer, and cut lot size to keep the cash risk fixed.
Frequently asked questions
What is the most reliable reversal candlestick pattern?
No single pattern wins alone, but the three-candle morning star and evening star tend to be the most reliable because they need three candles to agree, with the engulfing patterns close behind. Reliability comes far more from where the pattern forms and whether the next candle confirms than from the pattern’s name.
Do candlestick reversal patterns work on M5 charts?
They print constantly on M5 and fail constantly, because each candle carries too few orders for the rejection to be real and the spread eats a large share of a small move. Use M5 candlesticks only to time entries in the direction of the H1 trend, not as standalone signals. H1 and H4 are where these patterns earn their keep.
How do I confirm a candlestick reversal before entering?
Wait for the candle after the pattern to close in its direction (above the pattern’s high for a bullish reversal, below its low for a bearish one), then enter at that candle’s open or on a limit near the pattern’s midpoint. If the confirmation candle never closes through the level, the pattern is void and you skip the trade.
What’s the difference between a hammer and a hanging man?
They are the same shape (a small body with a long lower wick) but form in opposite places. A hammer prints at the bottom of a downtrend and is bullish; a hanging man prints at the top of an uptrend and is bearish. The candle looks identical, so the preceding trend is the only thing that tells you which one you have.
Do reversal candlestick patterns work on gold (XAU/USD)?
Yes, but gold’s long wicks fake more hammers and shooting stars than any forex pair, so demand bigger, cleaner patterns: a tradeable gold hammer has a lower wick of several dollars per ounce. Size stops for gold’s noise, often $4 to $8 per ounce on H1 versus 8 pips on EUR/USD, and ignore any reversal within 30 minutes of US news.
Why do my candlestick reversals keep failing?
The three usual causes are trading the pattern in mid-air with no level under it, entering before the next candle confirms, and fighting a strong higher-timeframe trend. News spikes and dead Asian-session liquidity account for most of the rest. Fix the location and confirmation habits first.
How many candles make a reversal pattern?
Between one and three. Single-candle reversals include the hammer, shooting star, and doji; two-candle reversals include the engulfing, piercing line, and dark cloud cover. Three-candle reversals include the morning star, evening star, three white soldiers, and three black crows. More candles generally means a stronger signal.
Can I trade reversal patterns without indicators?
Yes, candlesticks are a price-action tool and need no indicators to read. Most traders add one context filter, such as a 200 EMA for trend or a marked support/resistance level, to decide where a pattern counts. The candle gives you timing; the level gives you location.
Glossary of related terms
- Body: the thick part of a candle between open and close; which is higher sets the direction.
- Wick (shadow): the thin line marking the high and low; long wicks show rejection.
- Confirmation: the candle after a pattern closing in its direction, turning a shape into a signal.
- Engulfing: a candle whose body fully covers the prior candle’s body, flagging a shift in control.
- Doji: a candle whose open and close are nearly equal, showing indecision; dragonfly and gravestone forms carry directional bias.
- ATR: Average True Range, a volatility measure used to size stops to current conditions.
Related reading
- Complete forex candlestick patterns guide
- How to use candlestick patterns in forex trading
- Engulfing pattern forex strategy
- Hammer pattern forex candlestick strategy
- Trend-following shooting star forex strategy
Forex and CFD trading carries a high level of risk and may not be suitable for all traders. The strategies and patterns described here are educational. Past performance does not guarantee future results. Test on a demo account before risking real capital.
Ready to put this into practice?
Open an account with a regulated broker and apply what you have learned. These are the three brokers we recommend:
Trading forex and CFDs carries a significant risk of loss and is not suitable for everyone. Broker links are affiliate links — we may earn a commission at no cost to you.