


Last updated:
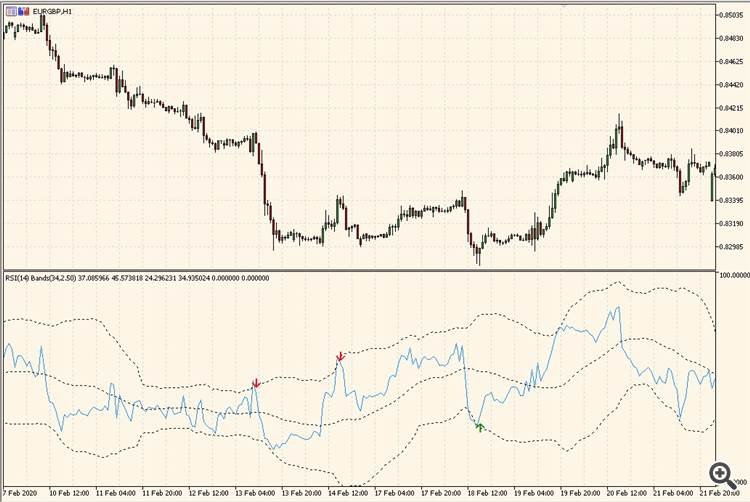
The indicator consists of an RSI and Bollinger bands calculated on it, it also plots arrows when RSI value was out of Bands and came again in Bands.
Enter Your Email Address below, download link will be sent to you.
Get Download Link