


Last updated: August 29, 2026 · By: Tim Morris
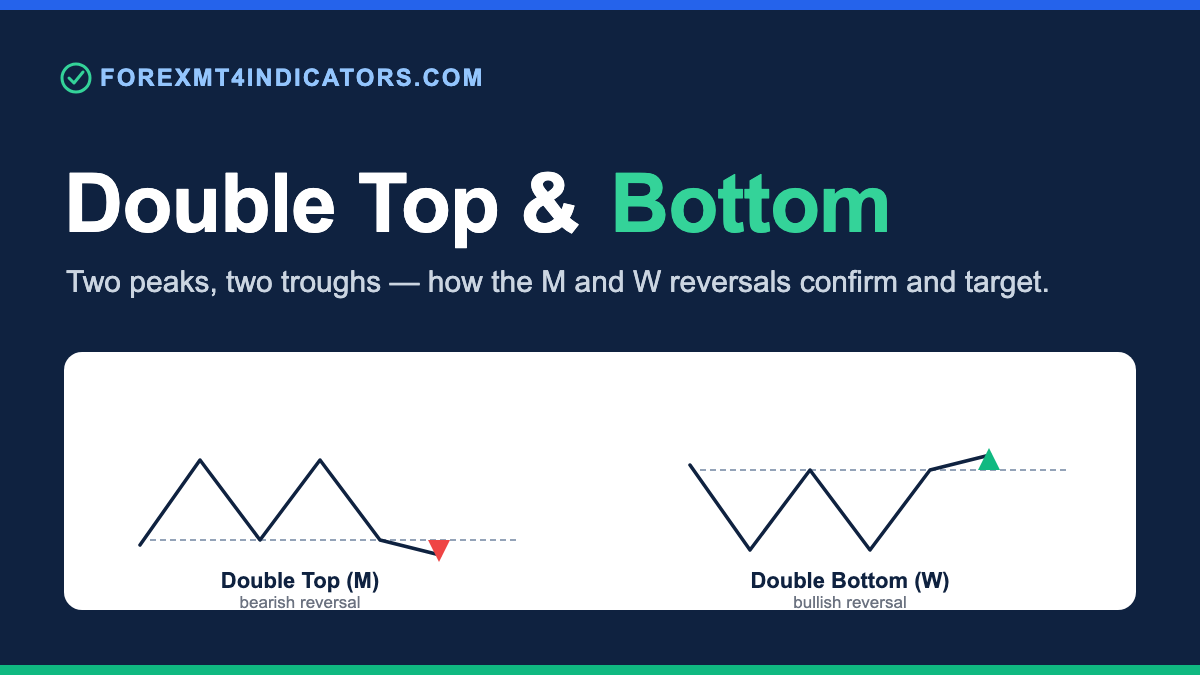
A double top is two peaks at a similar level with a trough between them, an “M” shape that warns an uptrend may be ending. A double bottom is the mirror “W” at the end of a downtrend. Neither is a signal until price closes beyond the neckline: the trough on a top, the peak on a bottom.
What is a double top and a double bottom
A double top is a bearish reversal pattern. Price rallies to a high, pulls back to a trough, rallies again to roughly the same high, then fails. The two failed peaks form the “M,” and the pullback low between them is the neckline that decides the pattern.
A double bottom is the bullish mirror. Price falls to a low, bounces to a peak, falls again to roughly the same low, then holds. The two failed lows form the “W,” and the bounce high between them is the neckline. Both patterns say the same thing: the trend tested a level twice and could not push through.
The key word is could not. A second peak at the same price tells you buyers ran out of force at that level, not that price must reverse. The pattern raises the odds of a turn; the neckline break is what turns those odds into a signal you can act on.
Triple tops and triple bottoms are the three-touch versions of the same idea. A third failed test at the level tends to draw more attention because more traders watch the same shelf, though the trade logic stays identical: wait for the close beyond the neckline.
The anatomy of a double top and double bottom
Every double top has four parts, and naming them keeps you honest about whether the shape is real. There is the first peak, the trough (the neckline), the second peak, and the break.
The two peaks should sit at a similar level, within a small tolerance rather than the exact same price. A second peak that prints a fraction lower is common and often stronger, because it shows momentum fading. A second peak that runs well past the first is not a double top. It is a new high, and the pattern is void.
The trough between the peaks is the pattern’s spine. On a double top that trough is the neckline: the support level price must close below to confirm the reversal. On a double bottom the roles flip, and the neckline is the peak between the two lows. The resistance price must close above.
Depth matters as much as symmetry. A shallow trough that barely dips between two peaks is a weak pattern, because there is little room for the reversal to travel. A trough with real separation from the peaks gives the measured move something to work with, which we cover in the target section below.
How to identify it on a chart
Start by finding an extended move, because a reversal pattern needs a trend to reverse. A double top that forms after a long rally is meaningful; the same shape inside a sideways range is often noise, since price is bouncing between levels rather than turning.
Mark the two peaks and check they align. Draw a horizontal line across them and a second line across the trough. Those two lines frame the whole pattern. If you need to squint or bend the lines to make the peaks match, the shape is not clean enough to trade.
Watch the space between the touches, too. A useful double top takes time to build; the two peaks are usually separated by several candles, not two adjacent bars. Peaks jammed together tend to be a single congestion zone rather than two distinct rejections of the level.
For a scannable reference on how this pattern sits beside every other formation, keep our chart patterns cheat sheet open in the next tab. It lists the double top, double bottom, and their triple cousins with the same break-then-measure logic used here.
The role of volume and location
Volume adds weight to the shape, even though spot forex has no central-exchange volume. On the tools most traders use, tick volume is the proxy, and the classic reading is that volume fades on the second peak or second bottom. Fading effort into the second touch fits the story: the side driving the trend is running low on fuel.
A pickup in volume on the neckline break adds confidence, because it suggests the other side is committing rather than drifting. Weak volume on the break is a caution flag, not a veto: many clean breaks on forex happen on ordinary volume during a quiet session.
Location is the other half of the read. A double top that forms into a prior resistance shelf, a round number, or a higher-timeframe supply zone is stronger than one floating in open space. The pattern and the level reinforce each other, which is the core idea behind trading double tops and bottoms using supply and demand zones.
How to trade it
Trading a double top or bottom comes down to one rule that outranks every other: no close beyond the neckline, no trade. This section stays at the level of trigger, stop, and target logic. The pip-level mechanics belong to the strategy spokes linked below.
The trigger is a candle closing beyond the neckline on your trading timeframe. For a double top that means a close below the trough; for a double bottom, a close above the peak. An intrabar spike that pierces the neckline and closes back inside is a fakeout, not a break: the close is what counts, not the wick.
The stop belongs on the other side of the pattern, not one pip beyond the neckline where a normal retest will hit it. On a double top the logical invalidation sits above the second peak; on a double bottom it sits below the second low. If price returns there, the pattern has failed and the reason to be in the trade is gone.
The target comes from the measured move, covered next. For the full entry-and-exit system with concrete rules, our double tops and bottoms forex trading strategy walks the execution end to end. Treat this page as the reference for what the pattern is, and the strategy page for how to trade it mechanically.
Reversal patterns read better when the candles at the level agree with the shape. A rejection candle at the second peak or second bottom is a useful tell, and The Candlestick Playbook covers that level-plus-candle read across many setups in one focused ebook for $27.
How to set a price target
The measured move is the standard way to project a target from a double top or bottom. You take the height of the pattern and project it from the break point. The height is the distance from the peaks to the neckline trough on a top, or from the lows to the neckline peak on a bottom.
Here is the logic with round numbers so the arithmetic is clear. Say a double top on EUR/USD prints its two peaks near 1.1000 and the neckline trough sits at 1.0900. The pattern height is 100 pips. Project that 100 pips down from the neckline break at 1.0900, and the measured target is roughly 1.0800.
A double bottom works the same way inverted. Two lows near 1.0800 with a neckline peak at 1.0900 give a 100-pip height; projected up from the break at 1.0900, the target is around 1.1000. The break point, not the neckline itself, is where you start the projection.
Treat the measured move as an objective, not a promise. Price often stalls at structure before reaching it, so many traders bank part of the position at the nearest support or resistance and let the rest run toward the full projection. The target frames the reward; it does not guarantee price will arrive.
When a double top or bottom fails
The most common failure is the second peak or second bottom giving way instead of holding. Price tests the level a second time and pushes straight through, which means the trend never stalled: it merely paused. This is why the pattern is not confirmed until the neckline breaks in the opposite direction.
The second failure mode is the false break: price closes beyond the neckline, triggers entries, then re-enters the pattern and reverses. False breaks cluster in thin liquidity and around high-impact news, when a single burst can pierce a level and unwind. A break during the quiet Asian session deserves more caution than one confirmed into London or New York.
A third failure is the pattern that forms with no trend behind it. Two peaks inside a range are only the range’s ceiling being tested twice, and there is no established move to reverse. The shape looks identical, but without a prior trend the reversal has nowhere to come from.
Location failures round out the list. A double top that forms in open space, with no level reinforcing it, has less holding power than one built into real resistance. When the pattern and the surrounding structure disagree, the structure usually wins.
Common mistakes traders make
Trading the shape before the break. A double top is a setup, not a signal, until price closes beyond the neckline. Fix: require a candle close through the trough (top) or peak (bottom) on your timeframe.
Demanding two identical peaks. Real peaks rarely match to the pip, and waiting for perfection means missing clean patterns. Fix: accept peaks within a small tolerance; a slightly lower second peak is often stronger.
Ignoring the prior trend. A double top with no uptrend before it has nothing to reverse. Fix: confirm an extended move preceded the pattern, and skip the shape when price is merely ranging.
Setting the stop one pip past the neckline. A normal retest of the broken level sweeps a stop hugging the line. Fix: place the stop beyond the second peak or second low, then size the position to keep cash risk fixed.
Skipping the measured target. Exiting on emotion gives back the edge the pattern created. Fix: project the pattern height from the break and set the target before entering.
Chasing a retest that never comes. Not every break returns to the neckline before running. Fix: split the entry: part on the confirmed break, part on a retest if it appears.
How the double top compares to triple tops and the head and shoulders
A double top and a triple top are the same pattern with a different number of touches. The double has two peaks at the level; the triple adds a third rejection before the neckline break. More touches can mean a more-watched level, but they also mean the pattern took longer to build and risks being spotted late.
The head and shoulders is the close relative worth knowing. Where a double top has two peaks at a similar height, a head and shoulders has a higher middle peak (the head) flanked by two lower shoulders. Both confirm on a neckline break and both use a measured move, so the family logic carries across.
Traders often mislabel a slightly uneven double top as a head and shoulders or vice versa. The distinction is the middle: level second peak means double top, higher middle peak means head and shoulders. When in doubt, the neckline break and the measured move are read the same way regardless of the label.
For the candle-level side of spotting these turns at a glance, save our free candlestick cheat sheet, a printable companion that pairs the reversal candles with the chart shapes on this page.
Double tops and bottoms on gold (XAU/USD)
The pattern forms on gold as clearly as on any forex pair, but XAU/USD carries a wider daily range, so the mechanics need adjusting. In 2026 gold trades above $4,000 an ounce with an average daily range near $60 to $110, which means the swings inside a double top are measured in dollars, not cents.
Frame the pattern in price distance first. If a gold double top prints peaks near $4,080 and a neckline trough at $4,020, the height is $60 an ounce: that is the distance you project down from the break, landing a target near $3,960. Convert to cash risk only after the price map is clear.
On our house convention, one XAU/USD pip equals $0.01, which is $1 per pip on a 100-ounce standard lot. A $60 pattern height therefore spans 6,000 pips on that ruler, or roughly $6,000 per standard lot of move. Stops need the same widening: hug the neckline on gold and a normal wick sweeps you out, so sit the stop beyond the second peak and cut lot size to hold the cash risk steady.
Frequently asked questions
What is a double top pattern in simple terms?
A double top is two peaks at a similar level with a pullback trough between them, forming an “M” after an uptrend. It warns the trend may be reversing down. It becomes a signal only when price closes below the trough, called the neckline, and the target is the pattern’s height projected down from that break.
What is the difference between a double top and a double bottom?
They are mirror images. A double top has two peaks at a similar high and points down, confirming on a close below the middle trough. A double bottom has two lows at a similar level and points up, confirming on a close above the middle peak. Both use the same neckline break and measured-move logic.
How do I confirm a double top or double bottom?
Wait for a candle to close beyond the neckline on your trading timeframe: below the trough for a top, above the peak for a bottom. A wick that pierces the neckline but closes back inside is a fakeout, not a confirmation. Until the close prints beyond the level, the pattern is a shape, not a trade.
How do I set a target for a double top or bottom?
Measure the pattern’s height (the distance from the peaks to the neckline trough on a top, or from the lows to the neckline peak on a bottom), then project that distance from the break point. If the height is 100 pips and price breaks the neckline, the measured target sits roughly 100 pips beyond the break.
Is a double bottom bullish or bearish?
A double bottom is bullish. It forms at the end of a downtrend as two lows at a similar level with a bounce between them, shaping a “W.” A close above the middle peak confirms the reversal up. Its counterpart, the double top, is the bearish version that forms at the end of an uptrend.
Do double tops and bottoms work on lower timeframes?
They form on every timeframe but are less reliable on the M5 and M15, where spread and random noise turn many neckline breaks into fakeouts. The H4 and daily produce cleaner patterns because each candle carries more orders. If you trade them intraday, favour the H1 and demand a decisive close beyond the neckline.
Why does my double top keep failing?
The usual causes are entering before the neckline closes, trading the shape with no prior trend to reverse, and setting stops so tight a normal retest hits them. False breaks also cluster in thin liquidity and around news. Wait for the confirming close, confirm a real trend preceded the pattern, and place stops beyond the second peak or low.
What is a triple top or triple bottom?
A triple top is a double top with a third failed peak at the same level before the neckline breaks; a triple bottom adds a third failed low. The extra touch means a more-watched level but a longer build. The confirmation and target rules are identical: a close beyond the neckline, then the pattern height projected from the break.
Glossary of related terms
- Double top: a bearish reversal of two peaks at a similar level with a trough between, shaped like an “M.”
- Double bottom: the bullish mirror, two lows at a similar level with a peak between, shaped like a “W.”
- Neckline: the trough on a double top or the peak on a double bottom; the level price must close beyond to confirm.
- Measured move: projecting the pattern’s height from the break point to set a target.
- Confirmation: the candle close beyond the neckline that turns the shape into a signal.
- False break: a close beyond the neckline that re-enters the pattern and reverses, trapping early entries.
- Triple top / bottom: the three-touch version of the pattern, with an extra failed test before the break.
- Reversal: a pattern that marks the end of the current trend rather than a pause within it.
Related reading
- Chart patterns cheat sheet: every major formation with its break and measured-target logic on one page.
- Double tops and bottoms forex trading strategy: the full entry, stop, and exit system for this pattern.
- Double top and double bottom MT4 indicator: the tool that flags these reversals on your chart.
- Trade double tops and bottoms with supply and demand zones: pairing the pattern with location.
Forex and CFD trading carries a high level of risk and may not be suitable for all traders. The patterns and rules described here are educational, and patterns show probability, not certainty. Past performance does not guarantee future results. Test any approach on a demo account before risking real capital.
Ready to put this into practice?
Open an account with a regulated broker and apply what you have learned. These are the three brokers we recommend:
Trading forex and CFDs carries a significant risk of loss and is not suitable for everyone. Broker links are affiliate links — we may earn a commission at no cost to you.