


Last updated: August 29, 2026 · By: Tim Morris
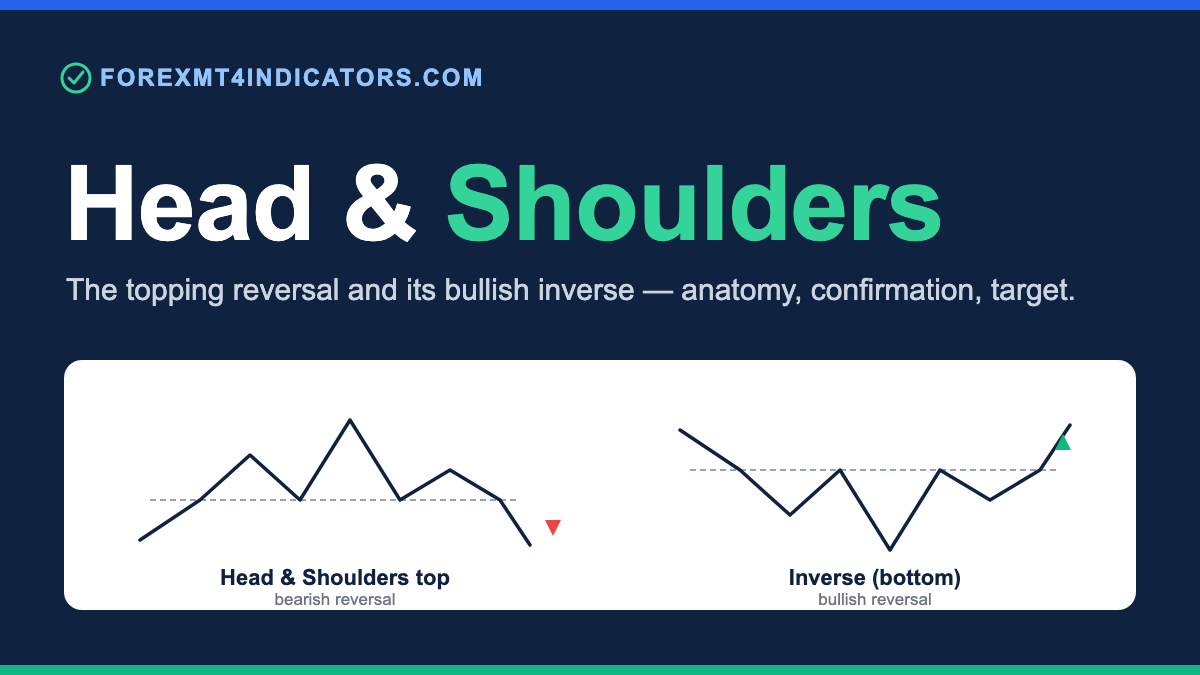
A head and shoulders pattern is a reversal formation: a left shoulder, a higher head, and a lower right shoulder resting on a support line called the neckline. It warns that an uptrend is losing strength. The signal only confirms when price closes beyond the neckline, not on a wick.
This guide covers both directions in one place (the topping head and shoulders and the bottoming inverse) so you can read either one from the same anatomy. For the exact entry, stop, and target mechanics, we hand you to the two strategy guides linked below.
What is a head and shoulders pattern
A head and shoulders pattern is a shape that price prints at the end of a trend, marking where the crowd driving the move runs out of participants. On a topping pattern it forms after an uptrend and points price down; on a bottoming pattern, called the inverse, it forms after a downtrend and points price up. The two are mirror images of the same story.
The shape carries three peaks. The middle peak (the head) is the highest, and the two peaks either side of it (the shoulders) sit lower and roughly level with each other. A line drawn under the two troughs between them is the neckline, and that line is the trigger.
Nothing about the shape is a certainty. A head and shoulders shows where the odds tilt toward a reversal, not where price must turn. The pattern becomes a signal only when a candle closes through the neckline, and until then it is a shape your eye has spotted, not a trade.
The anatomy of a head and shoulders pattern
Read a topping head and shoulders left to right and it tells a clean story of a trend failing. The left shoulder forms when an uptrend makes a high, pulls back, and prints the first trough. The head is the next push that makes a higher high before falling back to a similar trough level, and the right shoulder is a third rally that fails to reach the head, turning down from a lower high.
The neckline connects the two troughs: the low after the left shoulder and the low after the head. It can run horizontal when the two troughs sit at the same level, or slope up or down when they do not. A neckline that slopes gently is normal; one that slopes steeply is a warning the pattern is messy and less trustworthy.
The two shoulders do not need to match to the pip. What matters is the sequence: a high, a higher high, then a lower high, each separated by a return toward the neckline. When the right shoulder turns down and price heads back to the neckline, the pattern is complete in shape and waiting on confirmation.
The inverse head and shoulders at a bottom
The inverse head and shoulders is the same anatomy flipped upside down at the end of a downtrend. The left shoulder is a low, the head is a lower low, and the right shoulder is a higher low: three troughs where the middle one is deepest. The neckline now connects the two peaks between those troughs and acts as resistance overhead.
The story mirrors the topping pattern. Sellers drive price to a new low at the head, fail to make a lower low on the next attempt, and the higher low of the right shoulder shows selling pressure fading. A close above the neckline confirms buyers have taken control and signals a move up.
Both directions confirm the same way and target the same way, which is why one guide covers them. If you want the full swing-trading rules for the bottoming version, our inverse head and shoulders swing trading strategy lays out the entry, stop, and target for that side.
How to identify it on a chart
Start with the trend before the pattern, because a head and shoulders only means something at the end of a real move. A topping pattern needs a prior uptrend to reverse; an inverse needs a prior downtrend. A three-peak shape in the middle of a sideways range is noise, not a reversal.
Then check the sequence and the neckline. You want a clear higher high for the head between two lower highs for the shoulders, and two troughs that a single straight line can connect without forcing it. If you have to bend the line or ignore a spike to make it fit, the pattern is not clean enough to trade.
Timeframe changes the quality of the read. A head and shoulders on the H4 or daily reflects enough orders that the shape carries weight, while the same shape on the M5 fires and fails constantly as spread and noise fake the peaks. The daily gives the fewest patterns and the cleanest ones, which suits swing and position traders.
Volume adds a layer of confirmation on markets that report it. In a classic topping pattern, volume is often heaviest on the left shoulder and the head, then lighter on the right shoulder as the rally loses conviction, and it tends to pick up on the neckline break. Spot forex has no central volume, so use tick volume as a rough proxy and lean on price structure first.
The psychology behind the pattern
The shape is a picture of a crowd changing its mind. During the left shoulder and the head, buyers are in charge and each dip is bought, pushing price to a fresh high. The head is the last hurrah: the final push that makes a higher high before momentum drains.
The right shoulder is where doubt sets in. Buyers try again but cannot lift price back to the head, and that failure to make a higher high is the first hard evidence the trend is turning. Sellers see the lower high and press, driving price back toward the neckline.
The neckline break is the moment the last buyers give up. Traders who bought the shoulders and the head are now offside, and their stops sit below the neckline. When price closes through, those stops trigger and add fuel to the move, which is why a confirmed break often travels with speed.
How to confirm the neckline break
Confirmation is a candle that closes beyond the neckline on your trading timeframe, not a wick that pokes through and pulls back. A daily close below the neckline confirms a topping pattern; a daily close above it confirms the inverse. The close is the whole point: an intrabar spike that closes back inside is a fakeout, and acting on it is the fastest way to get trapped.
Neckline shape changes how you draw the trigger. On a horizontal neckline the level is obvious, and the break is clean to judge. On a sloped neckline the trigger line moves over time, so extend the line forward and require the close to clear it at the candle you are reading, not where the line sat a week ago.
Some traders wait for a retest before committing. Price often breaks the neckline, then pulls back to it (the old support becoming new resistance on a top, or old resistance becoming new support on the inverse) before continuing. A retest that holds gives a second, lower-risk entry, though not every break offers one, and waiting for a retest that never comes means missing the move.
How to trade it, conceptually
The trade logic is the same three-step frame every chart pattern uses, and the exact numbers belong to the strategy guides rather than here. First, you confirm the reversal with a neckline close. Second, you define risk against the pattern’s own structure. Third, you set a target from the measured move.
The trigger is the neckline close. The natural place for a stop is beyond the right shoulder (above it on a topping pattern, below it on the inverse) because a return past the shoulder says the reversal has failed and the pattern is void. The target comes from the pattern height, covered in the next section.
We keep the pip-level entry, stop, and position-sizing rules in the dedicated spokes on purpose, so this page stays a reference and not a mechanical system. For the topping side, see our head and shoulders swing trading strategy; for the bottoming side, the inverse head and shoulders strategy mirrors it. Both add the timing details this concept guide leaves out.
How to set a price target with the measured move
The measured move is the pattern’s built-in target, and it comes from the pattern’s own height. Measure the vertical distance from the top of the head straight down to the neckline, then project that same distance from the point where price breaks the neckline. On a topping pattern you project it downward; on the inverse you project it upward.
Work it conceptually with round numbers to see the logic. Say a topping pattern on EUR/USD has its head at 1.1200 and the neckline directly below the head sits at 1.1000, a height of 200 pips of price distance. A close below the neckline projects a target near 1.0800, which is 200 pips beneath the break.
The same method reads on any market once you frame it as price distance first. On gold (XAU/USD), if the head prints near 4,120 and the neckline sits at 4,040, the height is 80 dollars per ounce of price distance. Project that 80-dollar move down from a neckline break near 4,040 and the target lands around 3,960, well inside gold’s typical daily range of roughly 60 to 110 dollars per ounce in 2026.
Treat the measured move as an objective, not a promise. Price can fall short of it, stall at a level in between, or run well past it when the break aligns with a larger trend. Marking nearby support or resistance between the break and the target tells you where the move might pause, so you can manage the trade rather than sit and hope.
When a head and shoulders fails
A head and shoulders fails when price closes back through the neckline after breaking it, which usually means the breakout trapped early sellers or buyers and the trend it was meant to reverse is still in charge. On a topping pattern, a close back above the neckline after a downside break voids the setup. This is common enough that the neckline close and a sensible stop are not optional.
The frequent failure is the false break: a candle that pierces the neckline intrabar, tempts traders in, then closes back inside the pattern. These cluster in thin liquidity, such as the late Asian session, and around high-impact news like CPI, NFP, and FOMC, where a release can spike price straight through a clean neckline and reverse. Waiting for the candle to close, and for the active London or New York session, filters out many of them.
A pattern can also break, retest, and then fail on the retest. Price closes through the neckline, pulls back to it, and instead of the old level holding as new resistance or support, it breaks back the other way. That is your signal the reversal has not taken, and traders who set stops beyond the right shoulder are protected when it happens. A failed head and shoulders often becomes a continuation of the original trend, so it pays to step aside rather than fight it.
Common mistakes traders make
Trading before the neckline close. A shape is not a signal until a candle closes beyond the neckline. Fix: require a close on your timeframe, a daily close for a daily pattern, never a wick.
Mismeasuring the neckline. Drawing the neckline through wicks or bending it to fit inflates or hides the pattern height. Fix: connect the two troughs (or peaks, on the inverse) with one straight line and measure the head-to-neckline height vertically.
Ignoring the prior trend. A three-peak shape inside a range is not a reversal because there is no trend to reverse. Fix: only trade a topping pattern after a clear uptrend and an inverse after a clear downtrend.
Forcing symmetry. Waiting for the shoulders to match perfectly makes you skip valid patterns and force invalid ones. Fix: judge the sequence, higher head between two lower shoulders, not millimetre symmetry.
Stops too tight against the neckline. A stop a pip beyond the neckline gets swept on a normal retest. Fix: place the stop beyond the right shoulder and size the position so the cash risk stays fixed.
Chasing a retest that never comes. Not every break pulls back to the neckline. Fix: decide in advance whether you take the break, the retest, or split the entry between the two.
Frequently asked questions
Is a head and shoulders bullish or bearish?
The standard head and shoulders is bearish: it forms at the top of an uptrend and signals a move down once price closes below the neckline. The inverse head and shoulders is bullish, forming at the bottom of a downtrend and signalling a move up on a close above the neckline. Both are reversal patterns, so the direction depends on which version you are reading.
How do I confirm a head and shoulders pattern?
Wait for a candle to close beyond the neckline on your trading timeframe: below it for a topping pattern, above it for the inverse. A wick that pierces the neckline and closes back inside is a fakeout, not confirmation. Many traders also wait for a retest of the neckline to hold before entering, which gives a second, lower-risk signal.
How do you calculate the price target?
Measure the vertical distance from the head to the neckline, then project that same distance from the point where price breaks the neckline: down for a top, up for the inverse. If the head is 200 pips above the neckline, the target sits 200 pips beyond the break. Treat it as an objective that price may fall short of or exceed, not a fixed outcome.
What is the neckline in a head and shoulders?
The neckline is the line connecting the two troughs between the shoulders and the head on a topping pattern, or the two peaks on the inverse. It acts as the support or resistance that price must close through to confirm the reversal. It can be horizontal or gently sloped, and a steeply sloped neckline makes the pattern less reliable.
Does the head and shoulders work on all timeframes?
The shape forms on every timeframe, but it is more reliable on the H4 and daily, where each candle carries enough orders for the pattern to mean something. On the M5 and M15 the same shape fires and fails often because spread and noise fake the peaks and necklines. Higher timeframes give fewer patterns but cleaner reversals.
What makes a head and shoulders fail?
It fails when price closes back through the neckline after breaking it, trapping traders who entered on the break. False breaks cluster in thin liquidity and around high-impact news, where a release can spike through the neckline and reverse. Trading before the close, mismeasuring the neckline, and ignoring the prior trend are the usual self-inflicted causes.
Is the inverse head and shoulders reliable?
It carries the same reliability as the topping version because it is the identical anatomy flipped at a bottom, and it confirms and targets the same way. Reliability comes from a clean prior downtrend, a clear higher low on the right shoulder, and a neckline close, far more than from the pattern’s name. As with any pattern, it is a probability that needs confirmation, not a certainty.
Should I wait for the neckline retest before entering?
A retest that holds gives a lower-risk entry, since the old neckline flipping to new resistance or support confirms the break has stuck. The trade-off is that not every break retests, so waiting can mean missing the move entirely. Many traders split the difference: taking part of the position on the break and adding on a retest if one appears.
Glossary of related terms
- Neckline: the line connecting the troughs (top pattern) or peaks (inverse) that price must close through to confirm the reversal.
- Head: the middle and most extreme peak or trough of the pattern, higher than both shoulders on a top, lower on the inverse.
- Shoulders: the two lower peaks (or higher troughs) either side of the head that frame the pattern.
- Measured move: projecting the head-to-neckline height from the breakout point to set a target.
- Retest: price returning to the broken neckline, testing it as new resistance or support before continuing.
- False break: a candle that pierces the neckline intrabar but closes back inside, trapping early entries.
- Reversal pattern: a formation that marks the end of a trend rather than a pause within it. See our chart patterns cheat sheet for how it sits among the others.
- Right shoulder: the final peak or trough that fails to exceed the head, the first evidence the trend is turning.
Related reading
- Head and shoulders swing trading strategy: the entry, stop, and target rules for the topping pattern.
- Inverse head and shoulders swing trading strategy: the same mechanics for the bottoming version.
- Chart patterns cheat sheet: every major pattern, bias, and confirmation on one page.
- Forex candlestick patterns guide: the candle-level signals that time entries inside these shapes.
If you want a save-and-print reference for the candle side of pattern trading, our free candlestick cheat sheet is the companion to the chart-pattern work above. And for the whole method (reading shapes, candles, and levels together) The Candlestick Playbook covers it in one focused ebook for $27.
Forex and CFD trading carries a high level of risk and may not be suitable for all traders. The patterns and rules described here are educational, and patterns show probability, not certainty. Past performance does not guarantee future results. Test any approach on a demo account before risking real capital.
Ready to put this into practice?
Open an account with a regulated broker and apply what you have learned. These are the three brokers we recommend:
Trading forex and CFDs carries a significant risk of loss and is not suitable for everyone. Broker links are affiliate links — we may earn a commission at no cost to you.