

Last updated: August 28, 2026 · By: Tim Morris


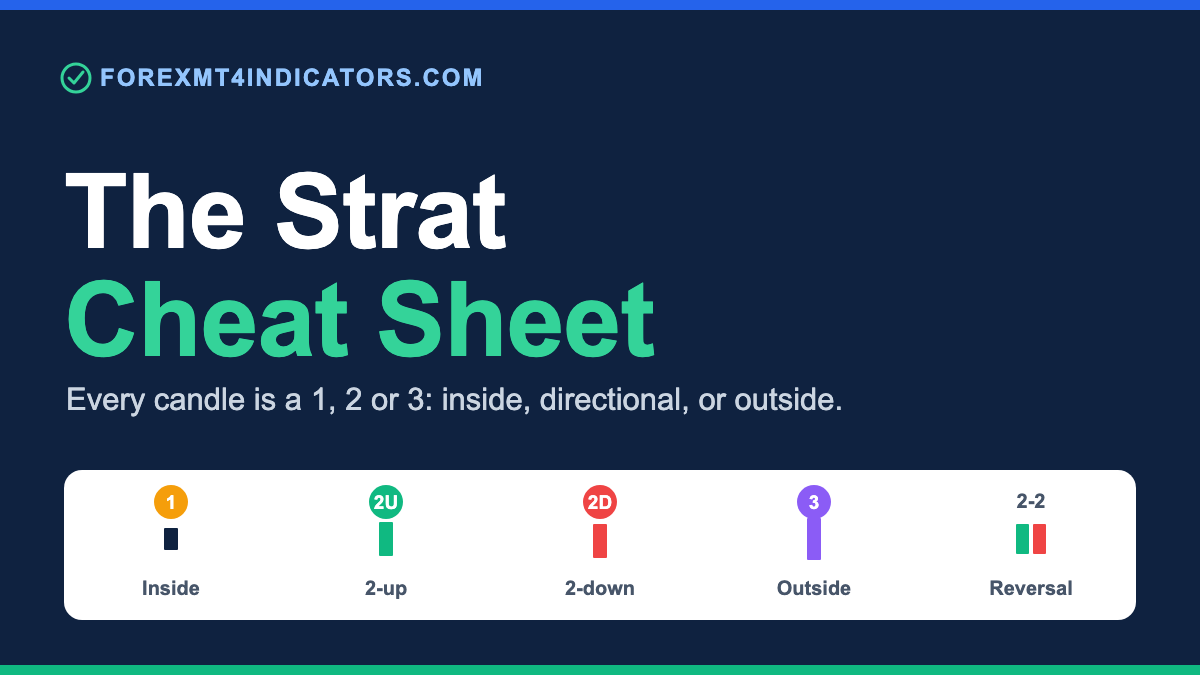
The Strat is a price-action method created by Rob Smith that classifies every candle as one of three scenarios: a 1 is an inside bar, a 2 is a directional bar breaking one side, and a 3 is an outside bar breaking both sides. Traders combine these numbers into setups like 2-2 reversals and 2-1-2s.
The appeal is that the numbering removes opinion from chart reading. A candle either broke the prior high, the prior low, both, or neither. There is no fourth option. If you already read Japanese candles, The Strat sits one layer underneath the classic forex candlestick patterns and describes the same bars using structure instead of names.
This cheat sheet gives you the three scenarios, the combos that matter, and the rules we use to act on them. Keep it next to your chart until the numbering becomes automatic.
Table of contents
- What is The Strat?
- The three candle scenarios
- The Strat combo cheat sheet
- How a Strat combo becomes actionable
- Timeframe continuity
- Broadening formations
- The Strat on XAU/USD (gold)
- Common mistakes
- The Strat vs classic candlestick patterns
- FAQs
What is The Strat?
The Strat is a technical method built by veteran trader Rob Smith. It reduces every price bar to a number based on one question: what did this candle do relative to the previous candle’s high and low? That single question produces three answers, and those three answers are the entire vocabulary.
Rob Smith’s core claim is that price only ever does three things. It stays inside the prior range (a 1), it breaks one side (a 2), or it breaks both sides (a 3). Everything else (trends, reversals, chop) is a sequence of those three numbers stacked together.
The method rests on three ideas Smith calls universal. First, there are only three candle types, so there is nothing left to argue about. Second, price is always either trending or building a broadening formation. Third, direction across multiple timeframes either agrees or it does not, and agreement is what makes a trade high-odds.
For a trader coming from named patterns, the shift is mechanical. Instead of asking “is this a hammer or a doji?”, you ask “did this candle break the prior high, the prior low, both, or neither?” That removes the guesswork that trips up new price-action traders.
The three candle scenarios
Every candle gets its number by comparing it to the candle immediately before it. Read left to right, one bar at a time, and mark each bar as it closes.
Scenario 1: the inside bar
A 1 is an inside bar. Its high is lower than the prior candle’s high, and its low is higher than the prior candle’s low. It fails to break either side. In plain terms, the whole candle fits inside the range of the one before it.
A 1 signals compression. The market paused, buyers and sellers balanced, and energy is coiling for the next move. Inside bars are the setup fuel of The Strat because the break of a 1 is a clean trigger with a tight stop.
If you have traded the inside bar price action strategy before, this is the same candle described with a number. The Strat treats the 1 as a pause inside a larger sequence, not as a standalone signal.
Scenario 2: the directional bar (2-up and 2-down)
A 2 is a directional bar that breaks one side of the prior candle and one side only. It splits into two forms. A 2-up (written 2U) trades above the prior high but does not take out the prior low. A 2-down (2D) trades below the prior low but does not take out the prior high.
The 2 is the workhorse of The Strat. Trends are chains of 2s in the same direction: a run of 2U candles is an uptrend, a run of 2D candles is a downtrend. Most tradeable setups end with a 2, because the 2 is the bar that actually delivers directional follow-through.
Mark the direction, not the color. A red candle can still be a 2-up if it poked above the prior high before closing lower, and that distinction changes the entire read.
Scenario 3: the outside bar
A 3 is an outside bar. It breaks both the prior high and the prior low: its range fully engulfs the candle before it. A 3 is the most volatile scenario because it shows both sides of the market got triggered inside a single bar.
Outside bars mark expansion. They often appear at the end of a coil, on news spikes, or where a broadening formation is widening. A 3 by itself is not directional; you wait for the next candle to tell you which way the expansion resolves.
Strung together, repeated 3s build a broadening formation of higher highs and lower lows: the choppy, whipsaw structure we cover further down.
The Strat combo cheat sheet
Single scenarios describe bars. Combos describe setups. A combo is a short sequence of two or three numbers that carries a directional bias once the final bar triggers. Here is the reference table we keep pinned.
| Combo | Example sequence | Type | What it signals |
|---|---|---|---|
| 2-2 reversal | 2D → 2U (bullish) / 2U → 2D (bearish) | Reversal | A directional bar is reversed when the next bar breaks the opposite side; momentum flips |
| 2-1-2 continuation | 2U → 1 → 2U | Continuation | Trend pauses on the inside bar, then resumes in the same direction |
| 2-1-2 reversal | 2U → 1 → 2D | Reversal | Inside bar coils, then price breaks the opposite way and reverses |
| 3-1-2 | 3 → 1 → 2U or 2D | Reversal / continuation | Outside-bar expansion, then a coil, then a clean directional break |
| 1-2-2 (Rev Strat) | 1 → 2U → 2D | Reversal | Inside bar breaks one way, fails, then reverses on the next bar |
| 3-2-2 | 3 → 2U → 2D | Reversal | Outside bar, one directional push, then a flip against it |
| 2-2-2 | 2U → 2U → 2U | Continuation | Extended directional run; a clean trend leg |
| 1-2 | 1 → 2U or 2D | Breakout | Simplest trigger: an inside bar breaks and goes directional |
| 1-3 | 1 → 3 | Expansion | Coil breaks into an outside bar; range expands both sides |
Read the sequences left to right. The last number is the one you trade, and the numbers before it are the context that gives the break its meaning.
Two combos deserve extra attention. The 2-1-2 is the most common because the inside bar in the middle gives you a defined trigger and a tight stop. The 1-2-2, which Strat traders call the Rev Strat, is the classic failed-breakout reversal: price breaks a level, traps the breakout crowd, then snaps back the other way.
How a Strat combo becomes actionable
A combo is only a picture until price triggers it. In The Strat, a setup becomes “actionable” the moment the current bar trades through the trigger level of the prior bar. The trigger level is the prior candle’s high for a long and the prior candle’s low for a short.
Our working rules keep entries mechanical. We enter on the break of the trigger candle’s high or low by 1-2 pips, so we are acting on a real break, not a wick that reverses. We place the stop 1-2 pips beyond the opposite extreme of the trigger candle, which is the exact point that invalidates the setup.
For targets, The Strat uses “magnitude”: the distance to the next prior pivot in the trade’s direction. Target 1 is the nearest opposing swing high or low; target 2 is the pivot beyond it if structure supports the extension. We move the stop to breakeven once price closes past target 1.
Timeframe matters here. On D1, H4, and H1 the scenarios are clean and the triggers hold. On M5 and M1 the outside-bar count explodes and half the triggers are noise, so we treat sub-M15 Strat signals as context only. This is the same discipline covered in our guide on how to use candlestick patterns in forex trading: the higher the timeframe, the fewer the false triggers.
Timeframe continuity
Timeframe continuity, or TFC, is Rob Smith’s term for direction agreeing across multiple timeframes at once. On any timeframe, price is either above its open for that period (bullish, often shown green) or below it (bearish, often red). When the daily, the H4, and the H1 all point the same way, you have full timeframe continuity.
Full timeframe continuity is where The Strat’s highest-odds trades live. A long 2U trigger on the H1 that lines up with a green day and a green H4 has the weight of the larger timeframes behind it. The same H1 trigger fighting a red daily is a countertrend trade and behaves like one.
The practical routine is top-down. Read the daily direction first, then the H4, then drop to the H1 or M15 for the entry trigger. If the entry timeframe disagrees with the higher ones, either skip it or size it smaller and take a faster target.
Continuity is not a guarantee. Alignment can break the moment a news release flips a timeframe. Treat TFC as a probability filter that stacks the odds, not a signal that removes risk.
Broadening formations
When price is not trending, The Strat says it is building a broadening formation. This is a run of outside bars and alternating 2s that carves higher highs and lower lows: an expanding, symmetrical mess that traps breakout traders on both sides.
Broadening formations are where accounts bleed. Each new extreme looks like a breakout, then reverses into the opposite extreme, and directional traders get chopped. On the chart it reads as a megaphone widening to the right.
The fix is to trade the edges back toward the middle, not to chase the breaks. Inside a broadening formation, a 2-2 reversal off a fresh extreme is higher-odds than a continuation, because the structure itself is designed to reverse. When the range finally resolves with a strong 2 and timeframe continuity behind it, the trend phase resumes.
The Strat on XAU/USD (gold)
The Strat is pure price structure, so it applies to XAU/USD the same way it applies to EUR/USD. The numbering does not care what the instrument is: a candle either broke the prior high, low, both, or neither. That makes gold a natural fit.
Gold’s behaviour changes the tuning, not the method. Because XAU/USD prints large wicks and frequent outside bars, especially at the New York open and around CPI, NFP, and FOMC, you will count more 3s on gold than on a major pair. Those extra outside bars mean more 2-2 reversals fire, and more of them are traps.
Widen your stops to match. On XAU/USD we place stops roughly 1.5x wider than the equivalent EUR/USD setup to survive gold’s wicks, and we avoid taking fresh Strat triggers in the 60 seconds around a red-folder release. On a 100oz standard lot, a $0.01 move (one pip) is $1 and a full $1 move in gold is $100, so a wider stop is a real increase in dollar risk that has to fit your position size.
Common mistakes
These are the errors we see most often when traders first pick up The Strat. Each one has a specific fix.
Numbering by candle color instead of by break. A red candle can be a 2-up and a green candle can be a 2-down. Fix: classify every bar only by whether it broke the prior high, the prior low, both, or neither. Ignore the body color entirely.
Trading the setup before it triggers. A 2-1-2 on the chart is not a trade until price breaks the inside bar. Fix: wait for the current bar to trade 1-2 pips through the trigger level before entering, so you act on a confirmed break.
Taking every signal on M1 and M5. Low timeframes produce a flood of outside bars and false triggers. Fix: restrict entries to H1, H4, and D1, and use anything below M15 as context only.
Ignoring timeframe continuity. A long trigger against a red daily is a countertrend fade dressed up as a setup. Fix: confirm the daily and H4 agree with your entry direction before taking an H1 trigger, or cut your size.
Chasing breakouts inside a broadening formation. Expanding ranges are built to reverse at the extremes, so breakout entries get whipsawed. Fix: when you see higher highs and lower lows expanding, fade the edges with 2-2 reversals instead of chasing the break.
No fixed stop rule on gold. XAU/USD wicks stop out setups that a currency pair would hold. Fix: widen stops to roughly 1.5x the EUR/USD equivalent and skip triggers within a minute of high-impact news.
The Strat vs classic candlestick patterns
Traders often ask whether The Strat replaces named candlestick patterns like engulfing bars, dojis, and hammers. It does not replace them. It describes the same candles with a stricter, rules-based grammar. The table below shows where the two approaches differ.
| The Strat | Classic candlestick patterns | |
|---|---|---|
| Unit | Each bar numbered 1, 2, or 3 | Named shapes (hammer, doji, engulfing) |
| Basis | Break of prior high/low | Body and wick proportions |
| Ambiguity | Low: four possible outcomes | Higher: patterns are judged visually |
| Trigger | Break of the trigger candle’s level | Often the close of the pattern candle |
| Best use | Structure and multi-timeframe context | Reversal and continuation signals at levels |
The honest read is that they overlap. A bullish engulfing candle is often a 2-up or a 3 in Strat terms; a doji at the top of a run is frequently a 1. Learning both gives you a named pattern for the visual and a numbered scenario for the mechanics.
If you want the named-pattern side kept short and printable, grab our free candlestick cheat sheet and read it alongside this Strat reference. Together they cover the same candles from two angles.
Frequently asked questions
What does 1-2-3 mean in The Strat?
In The Strat, every candle is numbered by how it relates to the prior candle. A 1 is an inside bar that breaks neither the prior high nor low. A 2 is a directional bar that breaks one side only (2-up breaks the high, 2-down breaks the low). A 3 is an outside bar that breaks both sides.
Who created The Strat trading method?
The Strat was created by Rob Smith, a veteran trader who developed it to remove opinion and ambiguity from chart reading. His premise is that price only ever does three things relative to the previous bar, so every candle can be classified as a 1, a 2, or a 3 with no room for interpretation.
What is a 2-2 reversal in The Strat?
A 2-2 reversal is two directional bars pointing opposite ways. A 2-down followed by a 2-up that breaks the prior bar’s high is a bullish reversal; a 2-up followed by a 2-down that breaks the prior low is bearish. The second bar reverses the first, and you trade the break in the new direction.
What timeframe is best for The Strat?
D1, H4, and H1 give the cleanest Strat signals because the scenarios hold and triggers follow through. M5 and M1 produce far more outside bars and false triggers, so we use them for context only. For swing entries, read the daily first, then drop to H1 or M15 for the trigger.
Does The Strat work on gold (XAU/USD)?
Yes. The Strat is pure structure, so the numbering works identically on gold. The tuning changes: XAU/USD prints more outside bars and wicks, especially around the New York open and CPI, NFP, and FOMC. Widen stops to roughly 1.5x the EUR/USD equivalent and avoid fresh triggers around high-impact news.
What is full timeframe continuity in The Strat?
Full timeframe continuity is when direction agrees across multiple timeframes at once: for example, the daily, H4, and H1 all pointing the same way relative to their opens. Trades taken with continuity behind them are the highest-odds Strat setups. Triggers that fight the higher timeframes are countertrend and carry lower odds.
Is The Strat the same as inside bar trading?
No, but inside bars are central to it. An inside bar is the Strat’s 1, and it powers many setups like the 2-1-2 and 1-2-2. The Strat adds directional 2s, outside-bar 3s, defined combos, and timeframe continuity, so it is a full structural framework rather than a single-pattern strategy.
Can I trade The Strat without indicators?
Yes. The Strat is a bare-chart method: you only need candles and the prior bar’s high and low to number each candle. Some traders add moving averages or session lines for context, but the scenarios and combos are read from raw price. That is part of why beginners find the numbering easier to apply than indicator-heavy systems.
Glossary of related terms
- Inside bar (1): a candle whose high and low both sit within the prior candle’s range.
- Directional bar (2): a candle that breaks one side of the prior candle; 2-up breaks the high, 2-down breaks the low.
- Outside bar (3): a candle that breaks both the prior high and the prior low.
- Actionable signal: a setup that has triggered because price traded through the prior bar’s high or low.
- Trigger candle: the bar whose high or low, once broken, activates the entry.
- Magnitude: the distance to the next prior pivot, used to set Strat targets.
- Timeframe continuity (TFC): direction agreeing across multiple timeframes at the same time.
- Broadening formation: an expanding structure of higher highs and lower lows built from repeated 3s.
- Rev Strat: the 1-2-2 combo, a failed-breakout reversal.
- 2-2 reversal: two opposite directional bars where the second reverses the first.
Related reading
- Forex candlestick patterns: the pillar guide to reading candles.
- Inside bar price action strategy: the standalone play behind the Strat’s 1.
- How to use candlestick patterns in forex trading: applying candle reads across timeframes.
- The Candlestick Playbook: our $27 ebook covering the named reversal and continuation patterns in depth.
Risk disclaimer: Forex and CFD trading carries a high level of risk and may not be suitable for all traders. The strategies and indicators described in this article are educational. Past performance does not guarantee future results. Always test on a demo account before risking real capital.
Ready to put this into practice?
Open an account with a regulated broker and apply what you have learned. These are the three brokers we recommend:
Trading forex and CFDs carries a significant risk of loss and is not suitable for everyone. Broker links are affiliate links — we may earn a commission at no cost to you.