

Last updated: August 28, 2026 · By: Tim Morris


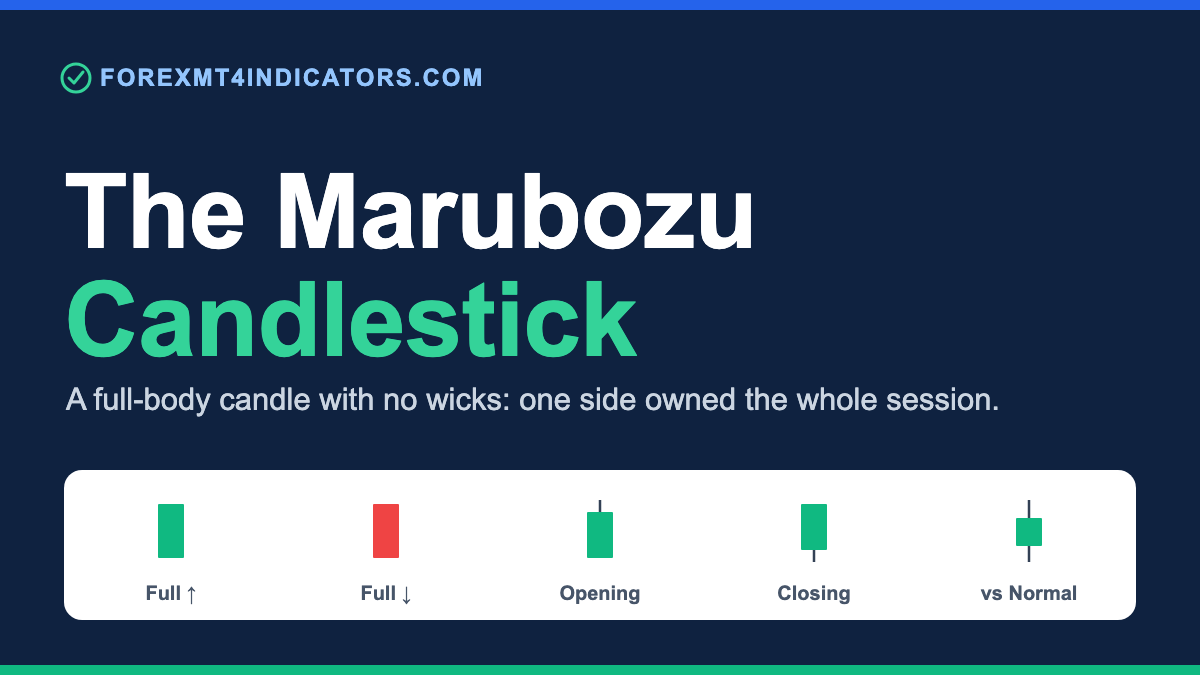
A marubozu is a candlestick with little or no wick: the body spans the entire session range, so one side controlled price from open to close. A bullish marubozu opens near the low and closes near the high; a bearish marubozu opens near the high and closes near the low. It signals conviction, not a reversal by itself.
The marubozu is one of the most direct reads in Japanese candlestick analysis. For the wider set of shapes it lives alongside (pin bars, engulfing candles, and doji), see our candlestick patterns guide.
What is a marubozu candlestick?
A marubozu is a single candlestick whose real body covers the full high-to-low range of the session, with no upper or lower wick worth mentioning. The name is Japanese for “bald” or “shaved head”: a candle with no hair (no shadows) at either end. It is one of the oldest reads in the rice-trading tradition Steve Nison brought to Western charts in the early 1990s.
The pattern is a conviction read, not a shape you memorise. When a candle opens and runs one direction to its close without pulling back, one side held control for the entire period. That single fact (no meaningful retracement inside the bar) is what every marubozu variant is telling you.
Direction is set by where the open and close sit. A bullish marubozu opens at or near the low and closes at or near the high. A bearish marubozu opens at or near the high and closes at or near the low.
Why the marubozu matters in forex trading
The marubozu gives you a one-glance strength gauge that most single candles cannot. A tall body with long wicks tells you the range was fought over; a marubozu tells you it was not.
That read matters most at two moments. On a break of support or resistance, a bearish marubozu closing below support says sellers drove it with no hesitation, stronger than a wicky candle that limped through. On trend continuation, a marubozu in the trend’s direction says the move still has a committed side behind it.
We treat it as confirmation, not a standalone trigger: it answers how much conviction was in a move, not where your entry, stop, and target belong.
The three marubozu variants
There are three variants, separated by how strict the no-wick rule is and where any small wick sits. The table is the fast reference; the sections under it explain the read.
| Marubozu type | Open sits | Close sits | Wick pattern | Reads as |
|---|---|---|---|---|
| Full bullish | at the low | at the high | none at either end | strongest buying |
| Full bearish | at the high | at the low | none at either end | strongest selling |
| Opening bullish | at the low | small upper wick | led from the open | strong, slight late fade |
| Opening bearish | at the high | small lower wick | led from the open | strong, slight late fade |
| Closing bullish | small lower wick | at the high | finished in control | strong into the close |
| Closing bearish | small upper wick | at the low | finished in control | strong into the close |
Full marubozu
A full marubozu has no wick at either end: the open is the low and the close is the high (bullish), or the open is the high and the close is the low (bearish). It is the strongest of the three because price never traded beyond the body in either direction, so on a bullish full marubozu buyers held control from the first tick to the last.
Opening marubozu
An opening marubozu has no wick on the open side but a small wick on the close side. A bullish opening marubozu opens at the low (buyers led from the start) but a small upper wick shows a minor late-session fade. It reads as strong with a slight loss of momentum into the close.
Closing marubozu
A closing marubozu is the mirror: a small wick on the open side, none on the close side. A bullish closing marubozu finishes at the high with no upper wick, so buyers were in command into the close even if the open was contested. We rate it the most useful of the three for continuation, because who controls the close often sets the tone for the next bar.
How to identify a marubozu on a chart
The check is mechanical: run it in seconds once you know the ratio to look for.
Measure the wicks against the range. For a full marubozu, the combined upper and lower wick should be under 5% of the total high-to-low range. Under 10% still counts as a near-marubozu you can trade; beyond that, it is an ordinary long candle.
Check which ends are bald. No wick at both ends is a full marubozu. No wick on the open side only is an opening marubozu; no wick on the close side only is a closing marubozu.
Confirm the body is large. The body should be at least 1.5x the average body of the last 10 candles. A small marubozu inside a quiet range is noise, not conviction.
Read the location. A marubozu mid-trend means continuation; one breaking a level means the break has force; one after an extended run into a major level can mean exhaustion. Location changes the trade.
For the marubozu next to every other single-candle read on one page, grab the free candlestick cheat sheet.
How to trade a marubozu
Trade the marubozu as continuation or breakout confirmation, in the direction the candle closed. It is a strength read layered on a level or a trend, never an entry taken in isolation.
Entry rules
- Continuation entry: in an established uptrend, enter long on a break above the high of a bullish marubozu, or on a shallow pullback to its midpoint that holds.
- Breakout entry: when a marubozu closes through support or resistance, enter on the retest of that broken level in the marubozu’s direction.
- Timeframe: H1, H4, and D1 carry weight. Skip marubozu signals on M1 and M5 in thin conditions.
Stop loss
- Placement: beyond the opposite end of the marubozu, below the open of a bullish marubozu, above the open of a bearish one.
- Sizing: add a buffer of 0.5x to 1x the ATR(14) of the timeframe so a normal wick does not clip you. On EUR/USD H1 that is often a 25-45 pip stop.
Take profit
- Target 1: the next structural level (prior swing, session high/low, or round number), typically 1:1 to 1:2 risk-to-reward.
- Manage: move the stop to breakeven once price clears 1:1, and let a runner target the next level if the trend is intact.
A D1 bullish marubozu closing above a multi-week range is a stronger continuation read than an H1 marubozu inside a session: higher timeframes reflect committed flow, not a single burst.
When the marubozu fails
A marubozu into a major level is the classic trap. A long bullish marubozu printed straight into well-tested resistance or a higher-timeframe supply zone is often the last of the buyers spending themselves: exhaustion, not continuation. We do not chase a marubozu that closes on top of a level; we wait for the next candle to confirm or reject.
On M5 in the Asian session (23:00-08:00 GMT), a marubozu means little. Low volume produces bald bodies that carry no institutional weight and reverse without warning on the London open. The same shape that is meaningful on the D1 is close to random on the M5 in a dead session.
News prints are the third failure mode. A marubozu on a CPI, NFP, or FOMC spike reflects a liquidity gap, not a sustainable one-sided market, and price often retraces the whole candle once the reaction settles.
The marubozu on XAU/USD (gold)
Gold prints long marubozu candles more often than the forex majors, and most arrive on news. A single XAU/USD H1 marubozu can span $8 to $20 during a CPI or FOMC release, so the same “strong candle” you would trust on EUR/USD needs more scrutiny on gold.
Two adjustments keep you out of trouble. Size stops off ATR, not a fixed pip count: gold’s next-candle wicks can be larger than a whole EUR/USD range. And treat any marubozu formed in the first minutes of a scheduled release as a liquidity event, not a signal.
On the D1, a gold marubozu that closes through a prior daily range is a genuine continuation read. On the M5 in the quiet Asian session, it is the same low-conviction noise you see on the majors, with a wider range to trap you.
Common mistakes traders make with the marubozu
Calling every long candle a marubozu. A long body with visible wicks is not a marubozu; the point is the absence of wicks. Fix: require combined wicks under 5% of the range for a full marubozu, under 10% for a near-marubozu.
Trading it against the trend. A single bullish marubozu inside a clean downtrend is often a stop-run, not a reversal. Fix: trade with the higher-timeframe trend, or wait for a structure break (BOS) before treating one as a turn.
Chasing a marubozu into resistance. The strongest-looking candle right into a major level is frequently exhaustion. Fix: do not enter on top of a tested level. Wait for the retest or the next candle.
Using it on M5 in thin sessions. Bald bodies in low-volume hours carry no weight. Fix: restrict marubozu trading to H1 and higher, and skip the Asian session on the majors.
Placing the stop too tight. A stop at the candle’s midpoint gets taken by a normal next-bar wick. Fix: place it beyond the marubozu’s open, plus a 0.5x-1x ATR(14) buffer.
Trusting a news-spike marubozu. A marubozu on the NFP tick reflects a liquidity gap, not a directional market. Fix: stand aside through the release and judge the first clean candle after the spread normalises.
Marubozu vs engulfing pattern
Traders often confuse the marubozu with a bullish or bearish engulfing candle because both look strong. They are different tools with different jobs, and the table settles it.
| Marubozu | Engulfing pattern | |
|---|---|---|
| Candles involved | 1 | 2 |
| Core signal | one-sided control within a session | a body that swallows the prior body |
| Wick rule | little to none | wicks allowed |
| Best used as | continuation / breakout confirmation | reversal at a level |
| Main failure mode | exhaustion into a major level | traps at range extremes |
| Best timeframe | H1, H4, D1 | H1, H4, D1 |
Use the marubozu for a strength read on a move already underway: a break of structure, a trend push, a level giving way. Use the engulfing pattern to hunt a turn at a level, because its two-candle structure captures a shift in control a single candle cannot.
The two combine well: a bearish engulfing at resistance followed by a bearish marubozu that drives the next leg down is stronger than either alone. The engulfing marks the turn, the marubozu confirms the follow-through.
Tools that flag the marubozu automatically
You do not need an indicator to read a marubozu, but two tools mark it for you across many pairs and timeframes.
- Candlestick pattern MT4 indicator: labels marubozu and the other core single- and multi-candle patterns on the MT4 chart.
- Japanese candlestick patterns indicator for MT5: the MT5 build, flagging the same pattern set as candles close.
For a reference that ranks each candle by reliability and pairs it with entry rules, the Candlestick Playbook ebook ($27) collects the full set on one ladder.
Frequently asked questions
What does a marubozu candlestick mean?
A marubozu means one side controlled price for the entire session with no meaningful pullback. The body fills the full range with little or no wick. A bullish marubozu shows buyers held control open to close; a bearish marubozu shows sellers did. It confirms continuation or a strong breakout.
Is a marubozu bullish or bearish?
It can be either. A bullish marubozu opens near the low and closes near the high, showing buying pressure; a bearish marubozu opens near the high and closes near the low, showing selling pressure. The position of the open and close gives the direction; the missing wicks tell you how one-sided the session was.
What is the difference between an opening and closing marubozu?
An opening marubozu has no wick on the open side but a small wick on the close side, so the controlling side led from the start and faded slightly late. A closing marubozu has a small wick on the open side and none on the close side, so control firmed into the close. We favour the closing type for continuation, because the close often sets the next bar’s tone.
Does a marubozu candle mean the trend will continue?
Often, but not always. A marubozu in the direction of an established H1-or-higher trend is a strong continuation signal. One printed straight into a major level, or on M5 in a thin session, can mark exhaustion instead. Read the location before assuming continuation, and wait for the next candle at key levels.
Can I trade a marubozu on the M5 chart?
We advise against it in most conditions. On M5, especially in the Asian session (23:00-08:00 GMT), bald bodies form on low volume and reverse without warning, and the spread eats a larger share of the small range. Restrict marubozu trading to H1, H4, and D1, where the candle reflects committed flow.
What is a good stop loss for a marubozu trade?
Place the stop beyond the opposite end of the candle (below the open of a bullish marubozu, above the open of a bearish one) plus a 0.5x to 1x ATR(14) buffer. On EUR/USD H1 that is often 25-45 pips. A stop at the candle’s midpoint is too tight; a normal next-bar wick takes it out before the move develops.
Does the marubozu pattern work on XAU/USD gold?
Yes, but with care. Gold prints long marubozu candles often, and many arrive on news: an H1 gold marubozu can span $8 to $20 on a CPI or FOMC release. Size stops off ATR rather than a fixed pip count, and treat any marubozu formed in the first minutes of a release as a liquidity event, not a signal.
Why did price reverse right after a marubozu?
Three common reasons: it ran into a major level and marked exhaustion, it formed on a news spike that was a liquidity gap, or it printed on a low timeframe in a thin session where it carried no weight. Check location, timeframe, and news timing before trusting the next move.
Glossary of related terms
- Real body: the thick part of a candle between the open and close; on a marubozu it is the entire range.
- Wick (shadow): the thin line above or below the body showing the high and low beyond open and close; a marubozu has little to none.
- Bullish marubozu: opens near the low, closes near the high; buyers controlled the session.
- Bearish marubozu: opens near the high, closes near the low; sellers controlled the session.
- Opening / closing marubozu: bald on the open side or the close side, with a small wick on the other.
- Doji: the opposite of a marubozu: open and close are nearly equal, signalling indecision.
- ATR (Average True Range): a volatility measure used to size stops relative to current conditions.
- BOS (Break of Structure): price breaking a prior swing high or low, confirming a trend shift.
Related reading
- Forex candlestick patterns guide
- Candlestick pattern MT4 indicator
- Japanese candlestick patterns indicator for MT5
Risk disclaimer: Forex and CFD trading carries a high level of risk and may not be suitable for all traders. The strategies and indicators described in this article are educational. Past performance does not guarantee future results. Always test on a demo account before risking real capital.
Ready to put this into practice?
Open an account with a regulated broker and apply what you have learned. These are the three brokers we recommend:
Trading forex and CFDs carries a significant risk of loss and is not suitable for everyone. Broker links are affiliate links — we may earn a commission at no cost to you.