


Last updated: August 28, 2026 · By: Tim Morris
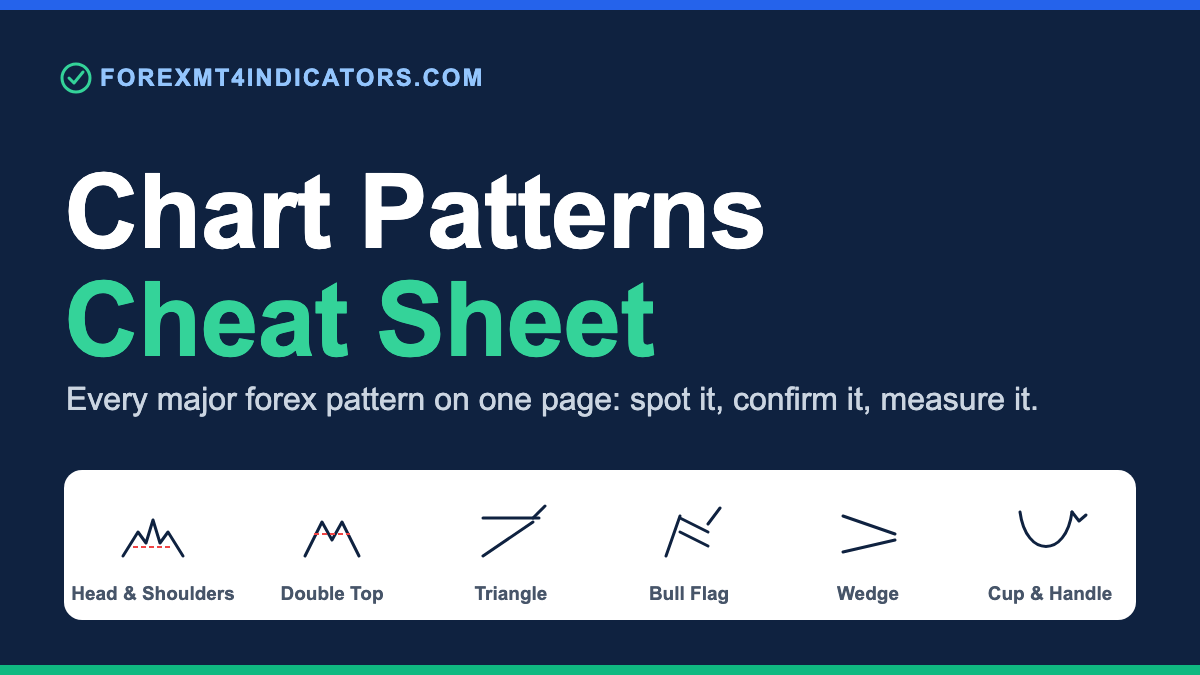
A chart pattern is a recurring price shape that hints at what price may do next. Traders sort them into three families: reversal patterns like head and shoulders, continuation patterns like flags and triangles, and bilateral patterns like the symmetrical triangle. This cheat sheet lists every major pattern, its bias, and the exact signal that confirms it.
Bookmark this page as your quick reference. For the candle-by-candle side of price reading, keep our candlestick patterns guide open in the next tab. Chart patterns and candlestick patterns answer different questions, and the best entries use both.
The chart patterns cheat sheet at a glance
Every pattern below reads the same way: find the shape, wait for the confirmation break, then measure the target from the pattern’s own height. Nothing here fires until price closes beyond the trigger level.
| Pattern | Family | Bias after break | Confirmation trigger | Measured target |
|---|---|---|---|---|
| Head and shoulders | Reversal | Bearish (top) | Close below the neckline | Head-to-neckline height, from the break |
| Inverse head and shoulders | Reversal | Bullish (bottom) | Close above the neckline | Head-to-neckline height, from the break |
| Double top | Reversal | Bearish | Close below the middle trough | Peak-to-trough height |
| Double bottom | Reversal | Bullish | Close above the middle peak | Trough-to-peak height |
| Triple top / bottom | Reversal | Bearish / bullish | Close beyond the shared level | Pattern height |
| Rounding bottom | Reversal | Bullish | Close above the rim | Depth of the bowl |
| Ascending triangle | Continuation | Bullish (usually) | Close above the flat top | Height of the widest part |
| Descending triangle | Continuation | Bearish (usually) | Close below the flat bottom | Height of the widest part |
| Symmetrical triangle | Bilateral | Direction of the break | Close beyond either trendline | Height of the widest part |
| Bull flag | Continuation | Bullish | Close above the flag’s upper edge | Length of the prior pole |
| Bear flag | Continuation | Bearish | Close below the flag’s lower edge | Length of the prior pole |
| Pennant | Continuation | Direction of the pole | Close beyond the pennant | Length of the prior pole |
| Rectangle | Continuation | Prior trend direction | Close beyond the range | Height of the range |
| Rising wedge | Reversal / continuation | Bearish | Close below the lower line | Height of the wedge’s back |
| Falling wedge | Reversal / continuation | Bullish | Close above the upper line | Height of the wedge’s back |
| Cup and handle | Continuation | Bullish | Close above the handle’s high | Depth of the cup |
Keep this table bookmarked, and pair it with our free candlestick cheat sheet: the candle-level companion you can save and print for the other half of the picture.
What is a chart pattern
A chart pattern is a shape that price draws over many candles as buyers and sellers fight for control. The shape reflects the balance of that fight. When one side finally wins, price breaks the pattern and often travels a distance related to the pattern’s own height.
Chart patterns fall into three families. Reversal patterns form at the end of a trend and warn that the move is running out of fuel. Continuation patterns form during a trend and mark a pause before price carries on. Bilateral patterns can break either way, so you trade the break rather than predict it.
None of these shapes are certainties. A pattern shows where the odds tilt, not where price must go. The confirmation break is what separates a real signal from a shape your eye wants to see. A pattern with no close beyond its trigger is not a trade yet.
Reversal chart patterns explained
Reversal patterns appear after an extended move and signal that the trend may be turning. They are the highest-value patterns for swing traders because they catch the start of a fresh move.
Head and shoulders
The head and shoulders is a topping pattern: a left shoulder, a higher head, then a lower right shoulder, all sitting on a support line called the neckline. A daily close below the neckline confirms the reversal from up to down. The inverse version flips this at market bottoms and signals a move up.
Measure the target by taking the vertical distance from the head to the neckline and projecting it down from the break point. For the strategy version with entry and stop rules, see our head and shoulders swing trading strategy.
Double and triple tops and bottoms
A double top prints two peaks at a similar level with a trough between them; a close below that trough confirms a bearish reversal. A double bottom is the mirror image and confirms on a close above the middle peak. Triple tops and bottoms add a third touch and tend to be more reliable because more traders watch the same level.
The target equals the pattern’s height (the distance from the peaks to the middle trough) projected from the break. We keep the double top and double bottom indicator on the chart to flag these automatically before the neckline gives way.
Rounding tops and bottoms
A rounding bottom is a slow, curved base that shows selling pressure fading and buyers taking over gradually. A close above the rim of the bowl confirms it. Rounding patterns take longer to form than sharp reversals, so they suit position traders on the daily and weekly charts.
Continuation chart patterns explained
Continuation patterns form inside a trend. They mark a rest, not a reversal, so the expected break is in the same direction the trend was already moving.
Flags and pennants
A flag is a short, tight consolidation that slopes against the trend after a sharp move: the “pole.” A bull flag drifts down inside an uptrend and breaks up; a bear flag drifts up inside a downtrend and breaks down. A pennant is the same idea but the consolidation forms a small symmetrical triangle instead of a channel.
Both flags and pennants target the length of the pole, measured from the breakout point. These are the fastest continuation patterns, which is why day traders favour them on the M15 and H1.
Triangles
An ascending triangle has a flat resistance top and a rising support line; it usually breaks up. A descending triangle has a flat support bottom and a falling resistance line; it usually breaks down. A symmetrical triangle has two converging lines and is bilateral: you wait for the close beyond either side and trade that direction.
Target the height of the triangle at its widest part, projected from the break. Triangles tighten toward a point, so the break tends to come before price reaches the apex.
Rectangles and wedges
A rectangle is a flat range between horizontal support and resistance; in a trend it usually breaks the way the trend was already going. A rising wedge slopes up with converging lines and leans bearish; a falling wedge slopes down and leans bullish. Wedges are the trickiest shapes because they can act as reversals or continuations depending on where they form. Our wedge pattern indicator draws the converging lines so you can judge the break rather than guess the slope.
Cup and handle
A cup and handle is a rounded base (the cup) followed by a small pullback (the handle) before a bullish breakout. A close above the handle’s high confirms it, and the target is the depth of the cup projected upward. It is a slow pattern best read on the H4 and daily.
How to trade any chart pattern
Every pattern on this page trades with the same three-step framework, which is what makes the cheat sheet usable under pressure.
First, draw the shape and mark the confirmation level: the neckline, the flat edge, the range boundary. Second, wait for a candle to close beyond that level on your trading timeframe; an intrabar spike that closes back inside is a fakeout, not a break. Third, place the stop on the other side of the pattern and set the target using the measured-move rule in the table.
A realistic risk-to-reward for a clean pattern break is 1:1.5 to 1:2. Patterns on the H4 and daily hold up better than patterns on the M5, where spread and noise turn many “breaks” into traps. If a break happens on thin volume during the Asian session, treat it with caution and wait for the London or New York session to confirm direction.
Common mistakes traders make with chart patterns
Trading the shape before the break. A pattern is a setup, not a signal, until price closes beyond the trigger. Fix: require a candle close, not a wick, beyond the level on your timeframe.
Forcing patterns that are not there. Draw ten trendlines and you will “find” a triangle on any chart. Fix: if the shape needs more than two clean touches per line to see, skip it.
Ignoring the trend context. A bull flag inside a downtrend is a weak trade. Fix: take continuation patterns only in the direction of the higher-timeframe trend.
Setting no measured target. Exiting on emotion gives back the edge the pattern created. Fix: project the pattern height from the break and set the target before you enter.
Stops too tight against noise. A stop one pip beyond the neckline gets hit by a normal retest. Fix: place the stop beyond the last swing that formed the pattern, then size the position to keep risk fixed.
Chasing the retest that never comes. Not every break retests the broken level. Fix: split the entry, part on the break, part on a retest if it appears.
Chart patterns vs candlestick patterns
Traders confuse these two, but they work on different scales and answer different questions. A chart pattern is the big shape across dozens of candles; a candlestick pattern is the message inside one to three candles at a key level.
| Chart patterns | Candlestick patterns | |
|---|---|---|
| Scale | Dozens of candles | One to three candles |
| Answers | Where is the trend heading | Who won this specific level |
| Best use | Structure and targets | Timing the entry |
| Examples | Head and shoulders, triangles | Engulfing, pin bar, doji |
| Confirmation | Close beyond the shape | Close of the signal candle |
The strongest entries stack both: a chart pattern tells you a double bottom is forming, and a bullish engulfing candle at the second low tells you the exact bar to act on. If you want the full candlestick side laid out the same way, our free candlestick cheat sheet is the companion to this page. And if you want the whole method (reading the shapes, the candles, and the levels together with entries, stops and exits) The Candlestick Playbook covers it in one focused ebook for $27.
Do chart patterns work on gold (XAU/USD)
Chart patterns form on gold as clearly as on any forex pair, but XAU/USD carries wider noise, so two adjustments matter. Gold’s daily range often runs $60 to $110 or more per ounce, and its wicks are longer, which means a stop a few cents beyond a neckline gets swept on a normal retest.
Widen the stop to sit beyond gold’s recent swing rather than hugging the pattern line, and size the position down so the cash risk stays the same. Around CPI, NFP, and FOMC releases, gold can spike straight through a clean pattern and reverse. Wait for the release to pass before trusting a break near those times.
Frequently asked questions
What is the most reliable chart pattern in forex
No pattern wins every time, but head and shoulders, double tops and bottoms, and ascending or descending triangles tend to be the most consistent because they form at clear structural levels many traders watch. Reliability rises on the H4 and daily and falls on lower timeframes where noise fakes out the break.
How do I set a target from a chart pattern
Measure the pattern’s own height (for a double bottom, the distance from the lows to the middle peak) then project that distance from the point where price breaks out. This “measured move” gives a target grounded in the pattern rather than a round number you hope price reaches.
Do chart patterns work on lower timeframes like M5
They form on every timeframe, but they are less reliable on the M5 and M15 because spread cost and random noise turn many breaks into fakeouts. If you trade patterns intraday, favour the H1, require a clean candle close beyond the trigger, and avoid thin sessions.
What is the difference between a flag and a pennant
Both are short continuation pauses after a sharp move, and both target the length of the prior pole. The only difference is shape: a flag consolidates in a small sloped channel, while a pennant consolidates in a small symmetrical triangle. You trade them the same way.
Are chart patterns the same as candlestick patterns
No. Chart patterns are large shapes spread across many candles, such as triangles and head and shoulders. Candlestick patterns are one-to-three-candle signals like the engulfing or pin bar. Chart patterns show structure and targets, while candlestick patterns time the entry, and strong setups use both together.
Can I trade chart patterns without any indicator
Yes. Chart patterns are pure price action, so you can draw them by hand on a clean chart. Indicators like a pattern scanner speed up spotting the shape, but the trade logic (break, stop, measured target) needs no indicator at all.
Why does my chart pattern keep failing
The most common causes are trading the shape before the confirming close, taking continuation patterns against the higher-timeframe trend, and setting stops too tight against normal noise. False breaks also cluster in low-volume sessions and around high-impact news. Wait for a clean close and place stops beyond the pattern’s last swing.
How long does a chart pattern take to play out
It depends on the timeframe it forms on. A flag on the M15 can resolve in an hour; a head and shoulders on the daily can take weeks to build and days to reach target. As a rule, the target takes roughly the same span the pattern took to form.
Glossary of related terms
- Neckline: the support or resistance line a head and shoulders or double top breaks to confirm the reversal.
- Measured move: projecting a pattern’s height from its breakout point to set a target.
- Breakout: the candle close beyond a pattern’s trigger level that turns a setup into a signal.
- Fakeout: a break that closes back inside the pattern, trapping traders who entered early.
- Pole: the sharp move before a flag or pennant, used to measure the target.
- Continuation: a pattern that resolves in the same direction as the prior trend.
- Reversal: a pattern that marks the end of the current trend. See our candlestick patterns guide for candle-level reversals.
- Bilateral: a pattern like the symmetrical triangle that can break either way.
Related reading
- Free candlestick cheat sheet: the candle-level companion to this page.
- Double top and double bottom strategy: the indicator that flags these reversals.
- Head and shoulders swing trading strategy: full entry, stop, and target rules.
Forex and CFD trading carries a high level of risk and may not be suitable for all traders. The patterns and rules described here are educational, and patterns show probability, not certainty. Past performance does not guarantee future results. Test any approach on a demo account before risking real capital.
Ready to put this into practice?
Open an account with a regulated broker and apply what you have learned. These are the three brokers we recommend:
Trading forex and CFDs carries a significant risk of loss and is not suitable for everyone. Broker links are affiliate links — we may earn a commission at no cost to you.